Thursday, July 17, 2025

Solving problems? Know the Network.

Below is a graphic that I shared in my July newsletter, and in my library.

This article is part of an on-line library hosted by an organization called, "The Commons".  Its title is "Power Mapping to Design a Winning Campaign Strategy".  Read it here

In its introduction, the article says, "To win a campaign, you need to correctly identify who has the power to fix the problem you want fixed. Then you need to pressure them to make the right decision. Power mapping is a tool to not only identify who holds that power, but, crucially, who holds influence over that person, and, therefore, who to target with your direct actions and campaign activities."

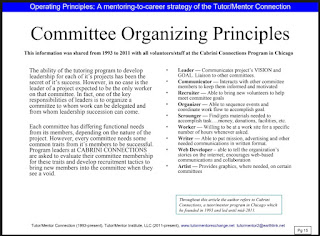
This is a strategy that I've followed, and shared, for more than 45 years.  The graphic below is a page from a visual essay showing the "operating principles" I followed in leading volunteer-based tutor/mentor programs in Chicago from 1975 to 2011.


This lists nine skills/abilities needed in planning and leadership teams to operate an effective program.  I used this to try to find volunteers to help me lead a program that grew from 100 pairs of youth/students in 1975 to over 400 pairs by June 1992.   Initially I used an Excel spreadsheet to list all my volunteers, their jobs and where they worked, then used this to sort for skills I was looking for. I could choose from three or four names based on where they worked, and how this might impact that company's support for us if the volunteer took on a leadership role.

In the 1990s I started using a FileMaker Pro database to collect information that I used to support my print and email campaigns, and used to invite people to networking conferences that I held in Chicago every six months from May 1994 to May 2015. That grew to about 13,000 people by 2003.  That's when we were forced to stop sending print newsletters due to lack of money.

I continued to use the database to recruit volunteers and donors for Cabrini Connections until I left in 2011. And, I used it to invite people to conferences until the last one in May 2015.  However, it did not translate very well to our email campaigns that began in the early 2000s. I estimate that we lost regular contact with more than half of the people we'd been sending print newsletters to. 

It still has contact information for tutor/mentor programs in Chicago that I host on the Tutor/Mentor website.   I still have it if anyone would like to do an analysis of the range of organizations I was sharing information with.

After forming the Tutor/Mentor Connection in 1993 I began to attend a number of meetings focused on reducing violence and improving schools.  I often thought to myself, "Who else should be in this conversation?" and "What other information should they be looking at?"   Those two thoughts have driven my thinking about network analysis for over 30 years.

In the 1990s I created the graphic that I show below.  It shows the design of a mentor-rich program, with volunteers coming from many different backgrounds and kids getting involved at one grade level and staying through high school graduation.  Our goal was that those connections would continue after kids graduated.  Today I saw a note on Facebook from one former student to a volunteer, celebrating the volunteer's birthday.  It shows that what we hoped would happen is really happening, at least for some former students and volunteers.

Another version of that is in this second graphic.  This shows how I share information via a website, blogs, social media, e-Mail newsletters and one-on-one conversations that I hope will be passed on to other people. Each spoke of the wheel represents someone who could be sharing information with his/her network.


Both graphics visualize the wide range of people who need to be involved in helping kids in areas of persistent poverty move through school and into jobs and careers.  In this visual essay, titled "Total Quality Mentoring" I use these graphics and show the role of leaders in mobilizing volunteers to support youth serving programs in every high poverty area of Chicago, not just the most visible areas.

Here's a graphic I created in the late 1990s that shows an application of this thinking.

The people in the first ring of your network may not be able to influence change.  However, if they share posts like mine in their networks, a lager circle of people are exposed to these ideas.  Ultimately, this can reach the "super hero" who has the most power and can be a "tipping point" in an organization's growth and ability to have an impact.  

Understanding who is participating.

By tracking attendance at the Tutor/Mentor Conferences I was able to create maps like the one below, showing who attended.  You can see maps from the 1998 and 2008 conferences on this page.  These show a good representation from tutor/mentor programs, but low participation from key people who need to be strategic in supporting these programs, such as business, philanthropy, government, research and media.


In the mid 2000s I began to learn about social network analysis (SNA). One of the leading thinkers was (and still is) Valdis Krebs.  In 2009 I wrote this article, titled "Nudge the Net: - how do we mobilize personal network to solve problems of inner city violence?"  I followed up with this article.  In both, I featured Krebs' work. 

In 2010 Valdis Krebs donated software to the Tutor/Mentor Connection and presented a "how to" workshop to interns who I recruited to do an analysis of conference participation.  Below is a map from a blog article created by one of those interns, showing participation in the November 2008 and May and November 2009 conferences.


Unfortunately these interns were only able to help me for a short period of time and I've not found anyone to continue this work since then.  Thus, I was not able to map more of the conferences and move to the next stage of understanding "Who is missing?" and "How do we get them involved?"

Around this time I created the concept map shown below, showing "talent needed" in any successful organization.  A parallel map shows "networks needed". 

These maps build upon what I was doing in the 1970s and 80s.  In many articles I've suggested that people use these as planning tools for building their own organization, making sure that someone has each of the talents highlighted.  And I've suggested to researchers that instead of just mapping "who participated", use concept maps like mine to show "Who needs to be involved".  Then compare the participation maps to the "aspirational" maps, to learn "Who's missing?"


In 2012 I created a network analysis map showing my Facebook followers. You can see the analysis in this PDF essay.   

I've written about network building and network analysis often since starting this blog in 2005. Here's a 2009 article that uses the concept map shown above.  And here's an article from 2023.

Are you doing this type of analysis? 

How can we apply ideas in the Power Mapping article to better understand who is part of the ecosystem of people and organizations that need to be working collectively toward building and sustaining programs and policies that address all of the challenges shown on the concept map below?

This map shows many of the issues progressives want to address and that the current administration seems to want to make worse for immigrants, people of color, people living in high poverty areas, and people with special needs. 

Using concept maps like I show above, researchers could build a database showing all the different people and organizations who need to be included in on-going learning and problem solving, for many years.  

I'm still connected to the boy I first tutored in 1973. He attended college and has to sons who have graduated from college.  

As you read the above, one thing you may, or may not, be thinking about is, "How does an individual, or an organization, do all of this network building, mapping and analysis?" How do they keep doing it for 20-30 years? Where do they find the money?"

Read some of my articles about having universities adopt my work, with it funded by wealthy donors.   

Become the "YOU" in the graphics shown above and share this article.  Maybe you, or someone you know, will use the Power Mapping ideas to identify one or more people who will move these ideas forward.

Thanks for reading.  Visit this page to see where you can connect with me on social media.

And, visit this page to make a contribution to help me continue to do this work. 

Saturday, July 12, 2025

Connecting people and ideas

In many of my blog articles I show a 50 year strategy of "connecting people and ideas".   I posted this article on the MappingforJustice blog this week to illustrate how I do this by adding links to my library.

Here's another example.  I saw this post from the Prison Policy Initiative today on Twitter (yes, I still visit the site). 

I've followed them for more than three years and added them to the Tutor/Mentor library in July 2022. When I did that I put them on a list of "new links added" that I had just begun.

Under the listing I included a "posted in this section" link, which pointed to the page in the library where I host that link, and many others with related information.  


I've also added it to the list of resources that I share in my monthly e-mail newsletter, as you can see below and in my most recent issue.   


And, I boost their posts when I see them on social media, hopefully drawing the attention of others to their work.

Why do I do this?  The two concept maps below show why.

The first shows my goal of helping kids and volunteers connect in multi-year tutor, mentor and learning programs that help them through school and into adult lives. It also shows that kids in areas of persistent poverty face many challenges that they and their families cannot solve by themselves. View the map at this link


The second shows the many different supports kids need at each grade level as they move from first grade to their first job and a career.  All kids need these supports. However, kids in areas of concentrated poverty have fewer than other kids.  That needs to change.  Click here to view.


In the lower left corner of this map is a statement saying, "Volunteers who get involved as tutors/mentors learn about these issues, and help provide these other resources.   In high poverty areas of big cities, structured programs are needed to connect youth with volunteers."

Unless volunteer-based programs have an on-going strategy that exposes their volunteers to this information, too few will take the extra steps that I describe in this concept map.  My newsletters, website and social media posts are aimed at program leaders, board members, donors and educators who can help instill habits of "learning" among volunteers, not just students.

One way to know if they do that would be to look for a "resources" page on the youth program's website, to see if it points to libraries like mine, or if they have other strategies for educating their volunteers.

Below is a graphic that shows the role I've taken, of connecting "people who can help" with information, and with places "where help is needed".


The issues we're dealing with today have been with us for many years. Why? Because too few people who don't live in poverty care enough to devote time, talent, dollars and votes to build and sustain the programs and policies needed to help those who do live in poverty.  And that means more than just building volunteer-based tutor/mentor programs.  There are a wide range of issues that need to be addressed. None are short-term solutions.

The Prison Policy Institute does a great job of calling attention to one part of the problem, which is the massive incarceration rates of people in the USA.  Another is the Incarceration Reform Resource Center, which I also list in my newsletter.  Unless more people see the information they are sharing and hosting on their websites, too few will understand the problem and be motivated to do anything about it.

What's your role? Be the YOU in this graphic. 


Share my posts. Share my newsletter. Share information in the Tutor/Mentor library.  Start a learning circle in your family, business, social circle, faith group, college, etc. where you use the information I and others are sharing to become more informed and more active in finding, and funding, solutions.

As I write this, I'm not forgetting the huge challenge facing our freedom and democracy. Many of the policies being rolled out by the Administration hurt poor people, and people of color, more than others. They hurt all of us and are making the world an even less safe place.  I started this section of the library during Trump's first term to help you find resources to improve our government.  The links I include should also be part of your reading and learning circles.

Connect with me on LinkedIn, BlueSky, Facebook, Twitter, Instagram and Mastodon. (see links here)

And, if you value what I'm sharing, and the library I host, please visit this page and make a contribution to help fund the work.

Thank you. 

Wednesday, July 09, 2025

New look for visual essays and videos

I spent the last week reformatting pages on the Tutor/Mentor website where I have shared videos, visual essays and concept maps in the past.

This is the revised format for my video library.  I'm showing page 1 of 3 pages. 


Below is what the page looked like before.


The new format is two columns wide.  Each image is larger than on the previous format. Where this really makes a difference is when you view the page on your phone.  Instead of seeing the whole page scrunched onto your phone screen, you see one image at a time as you scroll through the page.

Below is page 1 of 5 pages of the reformatted visual essays page.


Below that is the first page of my concept map library.


I also reformatted pages showing visualizations and videos done by interns between 2005 and 2015. I posted this article on the intern blog to share those. 

As you look at my collection of visual essays you'll see presentations like this, where I've encouraged high schools, colleges and universities to create a Tutor/Mentor Connection study and action program on their own campus.


The interns who worked with me spent time reading my blog articles and looking through my website, then created their own interpretations, using various forms of visualization.  They were building new skills while learning new ideas. They were actively helping share ideas that could help more youth living in areas of persistent poverty get on-going tutor, mentor and learning support that would help them through high school, college and into adult lives and careers.  

Their articles focus on Chicago. The last were done in 2015, 10 years ago. That means there is a lot of new content that could be reviewed.  Any university in Chicago or any other place could have students doing this same work, and could soon have a page on their website showing student work, just as I do.

A few years ago I wrote an article titled "Tipping Points: Growing and Supporting New Leaders". In it I showed how universities could be building a new wave of leaders who work directly in youth serving organizations while training others to become more proactive in supporting nonprofit and social benefit organizations from their roles in business, professions, policy makers, etc. 

It's the type of article student learners could review and reproduce in ways that might influence more people to actually adopt the ideas!  Many might continue such work through their adult lives.

That's the goal.

I can be found on LinkedIn, BlueSky, Facebook, Instagram, Mastodon and Twitter (see links here).  I hope you'll connect with me.

If you appreciate what I share on my blogs and in the Tutor/Mentor library, please consider a contribution to help me pay the bills.  click here