Showing posts with label systems thinking. Show all posts

Saturday, July 11, 2026

Systems Thinking - Case Studies

 A few days ago I found this post on LinkedIn by Simon MacCormac. It shared a paper he wrote about Systems Thinking.  That's a topic I've written about often in the past. 

I started a conversation that ultimately asked, "Who is aggregating links to case studies showing the application of systems thinking in solving complex problems?"

Today Simon shared two links. The first is SCiO (Systems and Complexity Organization) which is building a library of case studies showing successful application of systems methodologies.  click here

Open the site and scroll through the collection.  If you're looking to solve a complex (or simple) problem you can find some ideas among these case studies.

The second is the Systems Thinking Case Study Bank, hosted by the UK Government. click here

I found the map shown above by scrolling through the list of articles on this page.  It was part of an interview with Caitlin Jones about a project aimed at reforming agricultural policy design.  There are many like this on the site.

I shared the graphic below and this article with Simon on LinkedIn. 


This shows my own application of systems thinking to visualize the many problems that need to be solved to make volunteer-based tutor/mentor programs available to K-12 youth in every high poverty neighborhood, then to help those programs build long-term connections between youth, volunteers and the program, that lead kids safely through school into adult lives.

Over the 30 years I've been leading the Tutor/Mentor Connection I've come to realize that this is only one of many challenges that need to be addressed. I show many of these on the right side of the graphic. Each one should have many people applying systems thinking practices to find solutions and make them available in every place where that problem persists.

That's a wicked problem. A huge challenge.  How to start? Collect information showing how others are already trying to solve the problem. Learn from that. Then begin innovating your own solutions.

As you do that share your ideas with me and others on LinkedIn and other social media platforms. We can learn from you as you learn from us.

If you appreciate what I'm sharing please help fund the work I'm doing. click here


Tuesday, July 22, 2025

What's your problem-solving process look like?

While I've tagged over 130 article on this blog with #planning, probably most of the one-thousand plus articles posted here since 2005 focus on the planning needed to help great, on-going, mentor-rich programs reach K-12 youth in all areas of persistent poverty. 

I show planning steps and information mapping below.  Do you have visualizations like these to show your problem-solving process? 

This concept map highlights steps in an on-going planning process which aims to influence what resource providers, businesses and policy-makers do, not just what kids, educators, program leaders and parents do.  click here to open

Below is another version of this planning process. click here to open


On both concept maps you'll see geographic maps used at the beginning of the planning process.  Unless you define what places you want to help, using a map, you could get a lot of people together, spend a lot of money, and still miss a lot of the places that need help the most.

On both concept maps I show a next step, of gathering available information about the problem, who's already working to solve it, who should be involved in planning and action steps, etc. 

Using that information the Tutor/Mentor Connection (1993-present) began creating maps to show locations of non school, volunteer-based tutoring and/or mentoring programs in 1993 and to follow media stories about shootings, gangs, or poorly performing schools, with map stories that talked about the availability (or lack) of tutor/mentor programs in the area surrounding the incident.  

My goal has been that maps and the library of programs and research be used by leaders in business, government, colleges, hospitals, faith groups and government to fill high poverty neighborhoods with a wide range of  youth development and workforce development based tutor and mentor programs.
(Read more in this article)

The map below is another example of my use of maps. 

I used these maps in this article. It shows how maps can be used in planning, to identify stakeholders who should be involved in the process.  It should lead to questions such as, "Do we invest in helping existing programs grow?  or, "Do we invest in new start-ups?"  The planning process should provide answers.

Here's another article, titled "Use Maps for Understanding and Serving Areas of Need."

In the concept maps at the top of the page I include links to the research section of the Tutor/Mentor library. It's shown in the map below. click here to open


The small boxes at the bottom of each node contain links to external websites and pages of my library, and to additional concept maps.

My goal has been to expand the information planners had available when developing new solutions to persistent problems.  A research team could dig into my library and the websites I point to when starting a planning process.  Ideally they already would have spent many hours learning what's in the library, so when a grant opportunity or new policy initiative is being discussed, they already know where they can find large amounts of information.

Concept maps can help people navigate this vast library.  Here's one of many articles I've written showing uses of concept map. 

I added two new resources to the research section of the library today.  Below is a view of one page from an extensive "Poverty & Wealth  Inequality" project created by Gene Bellinger, a systems thinking pro who I've learned from for more than a dozen years.  You can see his influence in the planning map shown at the top of this article.  


Open this link to start your journey.  Gene has used AI to create a series of stories and relationship maps, that show a not-to-distant future where the rich and powerful have taken full control. His stories show how people have built a resistance that ultimately overthrows that government and replaces it with one more fully committed to the welfare of all people and the planet. Open the link to start reading the stories and open more and more pages.   

You won't see the interactive graphic shown above until you open the html file that Gene points to in the upper right of the page.   If you open that file you'll find an interactive map. That means you can zoom in to look more closely at different elements. You can click on nodes to read the text. You can create and share your own versions, as I'm doing. 

There's a load of information.  When you open the link to start your journey you'll see a list on the left side of your screen, which I show below.  


Each link on this page opens to a story, with additional maps.  As my #CLMOOC friend Terry Elliot would say, it's like "going down a rabbit hole" of learning. You just keep going deeper and deeper.

View this short video to see Gene Bellinger's introduction to AI Modeling.

Which leads me to the map shown below.  At the top of the third column from the left is a "Project 2025" link.  Click here to open that page. 


If you don't go any further you'll be lost because the concept map shown with the article has so many nodes that it's impossible to read.  However, if you open the html version, as I did, you can zoom in to look more closely at the elements on the map.  For those concerned with the direction the USA is going, this is a valuable map. 

Last week I wrote an article titled "Solving problems? Know the Network."  I pointed to a Power Mapping article that provides steps for learning who you should be connecting with to be able to solve the problem you're trying to solve (or to build the business you're building).  The Project 2025 map is an example of Power Mapping

All of this is just part of the first stage of a planning process.  It's really on-going because problem solving is cyclical. As you solve the first problem you face new problems, which require new information, and new people and resources.   Furthermore, this process is at different stages in thousands of places where people are trying to solve the same problem.  If information showing what each group is doing is available in web libraries, planners should be able to learn from each other, and not be constantly "reinventing-the-wheel". 

One of your challenges will be to build this network, then sustain and expand it over many years.  That's Step 1 in the concept map shown below. 


However, it's Step 2 and Step 3 that are more difficult.  Step 2 focuses on generating on-going attention that draws a growing number of people to the library and blogs like mine.  Step 3 focuses on helping people find what they are looking for, understand what they find, and apply what they learn in actions that help solve the problem you're focused on.

If the process works, it leads to Step 4, where planners find lists of organizations to support, or tools to fill voids where new organizations are needed.  The public awareness generated in Step 2 aims to motivate people to volunteer time, talent and dollars supporting youth serving programs in the area planners are focused.  In my case, that's been the Chicago region since 1993.  My list of tutor/mentor programs can be found here

I've never had much money for any of this, particularly Steps 2 and 3.  So I've focused on motivating other people to share the message and help build understanding.  It's what faith leaders have done for over 2000 years.  

How might athletes and celebrities support this process?  In February 2024 I wrote this article after watching the NFL annual awards presentation.  I wrote this article in 2023.  These show how athletes in major sports and many celebrities could go beyond the individual charity efforts they support to call greater on-going attention to the needs of entire neighborhoods and cities.  I wondered if anyone was aggregating information about all the foundations and causes athletes and celebrities support, so a  library and Power Map could be created that planners could use to better understand who is, or is not, being served, and who might be able to help draw greater attention to specific issues.   

Is anyone doing this?

7-23-2025 update - read this post by Dave Snowden and you'll see the same thinking as in my planning maps.

Thanks for reading.  Share your thoughts about mapping information libraries with me on LinkedIn, BlueSky and other social media platforms (see links here). 

If you value what I'm sharing please make a contribution to help me pay the bills.  Click here

Thursday, September 05, 2024

Mapping Birth-to-Work Strategies

 I've used visualizations like the one below for more than 20 years to show the need for long-term, birth-to-work strategies, that reach K-12 youth in every high poverty area of Chicago and other places with concentrations of persistent poverty.

I included this graphic in this July 2018 article titled "After the march, do the planning".   It's one of more than 200 articles posted on this blog that focus on "violence" prevention and "planning".  My goal is that youth and adults from around the USA are are reading these articles and sharing their interpretations with friends, family and co-workers to help mentor-rich birth-to-work programs grow in every high poverty area of Chicago and other parts of the country.

You can look at the graphic above in several ways.

1) It includes a map, showing high poverty areas of Chicago. Programs that help kids through school and into adult lives need to be in every one of these zip codes.

2) The horizontal arrow shows the "birth-to-work" timeline, which takes 20-25 years for EVERY youth. Those in high poverty areas don't have the same range of natural support that kids in more affluent areas have, so those supports need to be made available through school and no-school hours programming.  I wrote this article focusing on some of the needed programming. 

3) You can also think of the graphic as a guide to investments needed.  Since the arrow, and the graphic above, shows stages kids grow through as they move from "birth-to-work", communities need to innovate ways to drive needed operating dollars, technology, talent and ideas into every high poverty neighborhood, making age appropriate programs available at each stage on the timeline.  Furthermore, at the right end of the arrow these supports need to be job training, interviews and JOBS!

M
aps need to be use for multiple purposes. They can show demographic and poverty data as layers of information, pointing to places where people need extra help. 

They can show access routes through neighborhoods which might help volunteers see more places where they can connect with youth in organized programs.

They can show locations of programs, and potential support, such as banks, colleges, hospitals, faith groups, etc. We created a Chicago tutor/mentor Program Locator in 2004 and updated it in 2008 to enable people to create a map view showing small sections of the city, that could be used in planning.  It's now an archive due to lack of continued funding. 

Maps can also show who's involved, as these Tutor/Mentor Leadership and Networking Conference maps demonstrate.  

Most importantly, maps can show a distribution of dollars and involvement.  Foundations,  companies and government programs have the ability to create maps that show where their dollars are landing, and/or where company volunteers are involved as board members, or volunteers serving as tutors, mentors, tech support or marketing and fund raising support.  

But there are also other types of maps that planners should be using.  View the concept map shown in the graphic below at this link.  It shows supports needed at each grade level, in EVERY high poverty area of Chicago and other places.


Here's another concept map to look at.  It shows challenges facing people in high poverty areas. While building great school and non-school programs is needed, removing the barriers enables these schools to have greater success.


Now, take a look at maps created with systems mapping tools like KUMU.


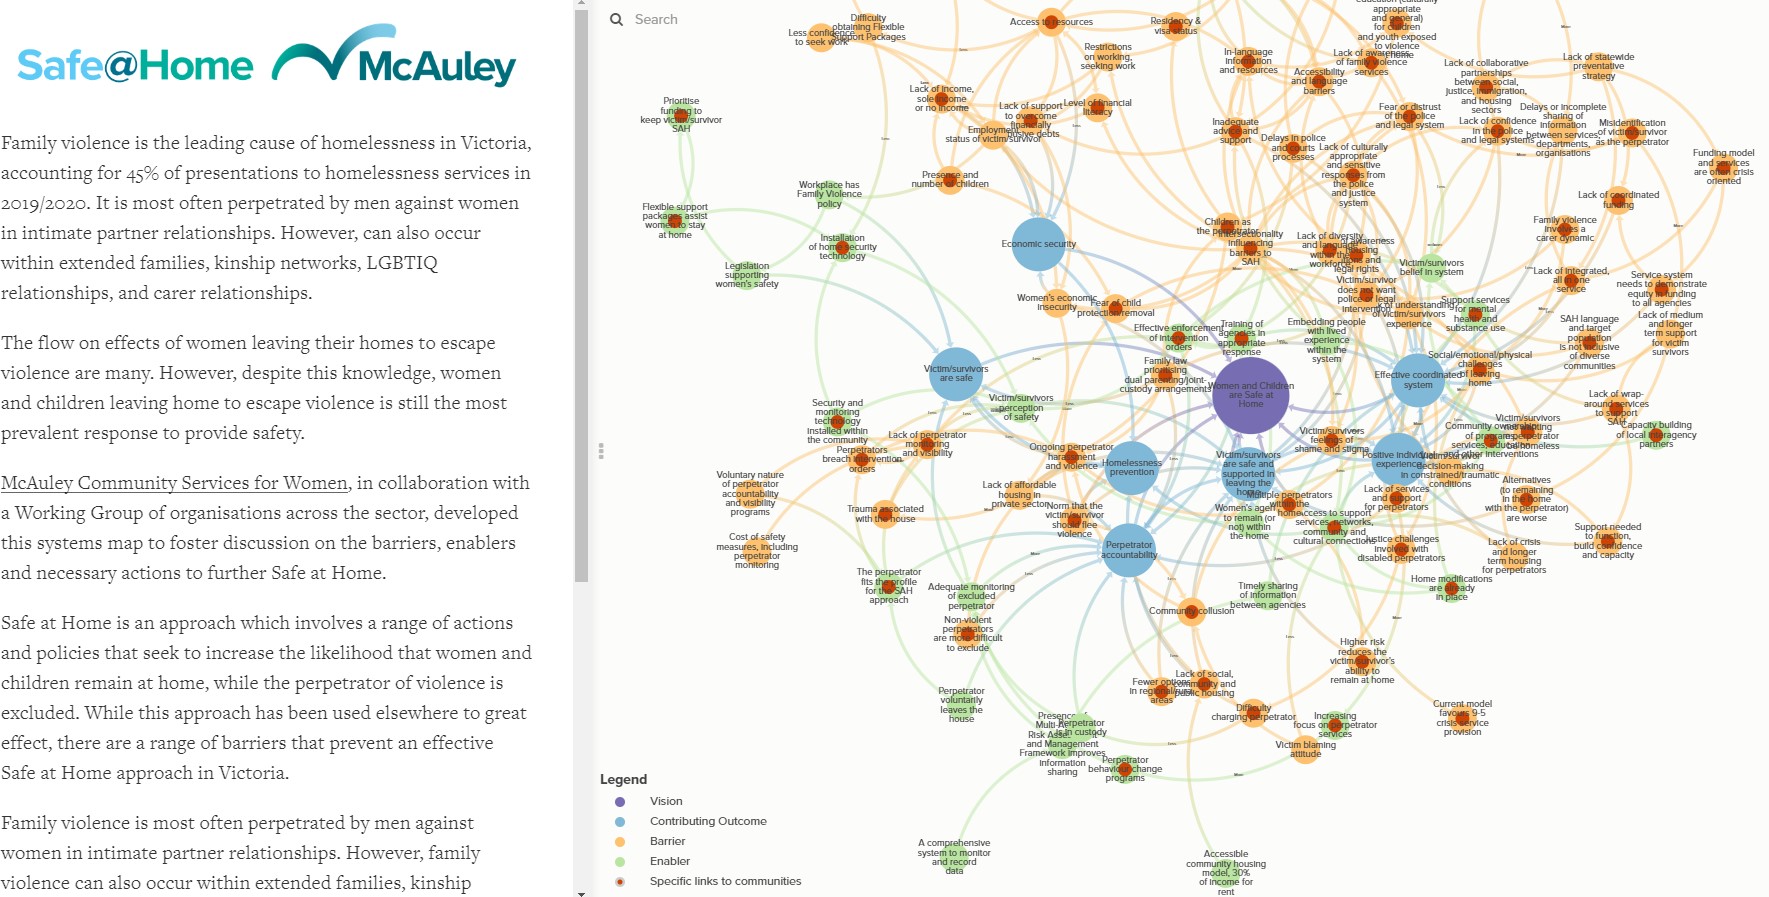
I've posted several articles showing how planners can use tools like KUMU.  On LinkedIn I found this post, by KUMU, showing a planning process focused on family violence in Victoria, Canada.  Open the project map at this link.   

Look at other examples that I've posted in these articles, including one showing how Senator Elizabeth Warren used a KUMU map in her 2016 Presidential campaign to show her strategy for empowering American workers and raising wages.    

Using GIS maps to show where help is needed and systems maps to help understand a problem and potential solutions, and guide resources to places where help is needed, can lead to new and better implementation of solutions.

So far I can find too few examples of maps being used this way, thus, there is little accountability assuring that funds and resources support all stages of the "birth-to-work" timeline, in every zip code where such programs are needed.

I no longer have the organizational capacity to update the program locator and implement these ideas. Instead, I want to be part of planning teams who read these articles and are trying to innovate ways to implement them in different locations.

In this article I show my 30 year history of reaching out to universities, and my continued goal that one, or many, universities begin doing the work that I describe in this and other blog articles.


As places with a brick-and-mortar investment in communities and a pipeline of students coming from high school to college, then on into adult lives and careers, universities are uniquely able to adopt long-term planning, if donors will provide long-term funding!

If you're doing this work, please use my resources and archives and invite me to help you make sense of it all!

I'm on these social media channels. If you're interested in knowing more and starting a conversation, just reach out to me.

If you want to help fund the work I'm doing, just go to this page and use PayPal to send your support. 

Thank you for reading.

Thursday, July 18, 2024

Understanding complex problems using concept maps

For many years I've posted articles describing the information-based problem solving strategies that I've piloted since forming the Tutor/Mentor Connection in 1993, and Tutor/Mentor Institute, LLC in 2011. 

Since 2005 I've communicated my ideas using concept maps, created using free cMapTools.  Below is one of those. Open the map at this link


This map includes three elements.

1) The "mentoring kids to careers" graphic focuses on the 10-16 years of age-specific support needed to help kids living in high poverty areas move through school and into jobs and careers.

2) There's a small inset of a map of Chicago, with high poverty areas highlighted.  In my last article I focused on using maps to understand where help is needed and to guide distribution of resources to all of these places.

3) The right side of the concept map shows many of the challenges that kids, families and schools in high poverty areas face. Each of these needs to be understood, then addressed. 

What my maps do not have is a narration on the maps that explains what the viewer is looking at. That could be fixed with an audio narration, or perhaps by using a different tool than cMapTools.  Below I'm pointing to some options.  I've tried to explain some of the maps with articles like this one and, this one

In the lower left corner of the concept map shown above, I wrote, "This information focuses on challenges facing youth in the United states.  What would this map look like for youth in Asia, Africa, Middle East, Europe, Central and South America?  Create your own version!"

Someone did! But I don't think this was inspired by my work.

Yesterday, I found Pierce Gordon who has used a different visualization tool, called KUMU.io, to create a visualization that focuses on Systems Thinking and Youth Unemployment in Botswana, Africa.  The graphic below is from that presentation.


I was alerted to this through a post I saw on Twitter (X). 
This Twitter (X) post includes a video that provides a quick overview of the analysis.  I encourage you to view it.

Then visit the KUMU page on LinkedIn where they announced the presentation and provided this link to the KUMU project shown in the video. 

Here's another systems map, shared with me by Pierce Gordon. It is an "interactive Youth Employment System Map. Designed in 2021. It is the first attempt to map the youth employment system in England. It provides a visual representation of the barriers and opportunities young people from marginalized backgrounds face as they seek good jobs."  Visit this page and then follow the link to the causal loop map. There are great explanations for how to use this, and why.  

Spend as much time as you can to look at these presentations, then connect with Pierce, or Kumu, or both and learn how you can make similar visualizations. 


Then, take a look at some of the past articles I've posted about mapping complexity.

This graphic by Christian Sarkar was included in my Nov. 17, 2022 post.

In this 2018 article my headline was "Wicked Problems. Getting "Everyone" in the Room. Who cares?   

When we started building our list of Tutor/Mentor programs  in 1993, we also began building a list of others who were already involved, or needed to be involved.  I can't tell you how many meetings I've been in when business, philanthropy, media, entertainment, sports and/or political leaders were not participating.  

Below is one of my concept maps that visualizes the talent and skills needed in a big, or small organization.


This concept map shows talent and skills. In the blue box at the top is a link to a similar map, that shows organizations.  If you don't have these skills in your tool box, or a representation from all of the stakeholders in the ecosystem, you'll have a tough time getting anything done, let alone changing complex systems.

Back in 1973 when I began volunteering as a tutor at the Montgomery Ward headquarters in Chicago, I realized I knew little of "being a tutor" so I started searching beyond my own program's training materials for other people who I could learn from.  As I did this, I began collecting names and addresses. When I became a program leader in 1975 I expanded this search, reaching throughout Chicago and the country to find people involved with volunteer-based tutor/mentor programs.

When an executive a Wards said in 1976 "Dan, you don't know much about leading a tutor/mentor programs. Why don't you invite other programs to lunch and see what you can learn."   I did. They came. We all shared and learned.  

I kept doing that for the next 46 years.  I found out that by keeping a list, I was the only one who could effectively "invite" people to gather, or could "knowledgably" speak about the availability of organized tutor/mentor programs in Chicago.  

Building and maintaining a list is a huge, on-going challenge.  That's another story. 

But why do this?

At the top of the graphic at the right I show outcomes that "we all want" for kids.  At the bottom I show the need for an information base which should include "who is involved, and who needs to be involved". View this graphic in this article

The Botswana article and the Youth Employment in England map both focus on "System Thinking".  This is what I hope you'll focus on.  

In the past, I've posted many articles focused on Systems Thinking. Here's one.  I've also pointed to KUMU.io in several articles

Another concept mapping tool that I've written about is NodeXL.  I point to it in this article, titled, "Building Networks - Understanding Who is Involved."

In my past articles you'll see how I've been influenced by the work of Gene Bellinger, who I met on LinkedIn many years ago.  He posted this article yesterday, showing a causal loop diagram created using a tool, called "the brain". The question this addresses is "If the current societal tendency is toward collapse or dystopia what might a third attractor look like?"  

I've recognized the potential value of Kumu, and these other tools, but because all of my concept maps were made using cMap Tools, I have not been willing to recreate them using any of them.  But, as I wrote above, I've invited others to take on that task.

Visualizations like the those I've shown in this post should be available in every metropolitan area in the world, as well as other geographies.  They address the "what do we know and what do we need to know" questions as well as "who is involved".  That should lead to, "who is missing, and how do we get them involved."

They should also focus on on-going actions that repeat over many years, and in many places. If you view my 4-part strategy map you'll see that all the information I point to in this article is just part of Step 1.  Step 2 and 3 focus on getting more and more people to look at this information and understand it.  Step 4 focuses on how people use this information in many places to help kids move through school and into jobs and careers.


There is a lot of information in this article, on my blog, and in the websites I point to.   It's too much for casual learning.  But if cities and countries are going to invest millions, or billions, of dollars in solving the complex problems we face, I feel they should invest a small percent in building an information base.

Looking at what I'm sharing should be part of their research.  Appoint someone from your team to follow these posts on LinkedIn and learn how concept maps and causal loop diagrams can support your planning and problem solving. 

One final thought. While the visualizations I'm point you to are fantastic, there needs to be a long-term, on-going effort, to share these and engage the public in using the information to help people in places where the maps show help is needed. I've been doing that on this blog since 2005.

If you've been doing work like this already, connect with me on social media (see where you can find me) and share what you're doing. 

If you value the information I'm sharing please visit this page and make a contribution to help fund the Tutor/Mentor Institute, LLC. 

7-19-2024 update - here's another KUMU visualization, titled "Aotearoa Futures Network Map" which explores the futures ecosystem in New Zealand.  click here

7-7-2024 update - Kumu.io is a network mapping tool. Here's a blog article showing how to map changes in a network over time.  Here's an example of a community growing over time. 

8-16-2024 update - here's a post on LinkedIn by KUMU, showing work done in Hawaii in 2022 and 2023 to create an Early Childhood Action Strategy.  Follow the links in the article to the project pages and KUMU visualizations. 

10-21-2024 update -  here's a post by Gene Bellinger where he talks about how he began creating systems thinking models.  His work has influenced my thinking since we met on-line more than 13 years ago.

11-18-2024 update - "Unlocking the Power of Systems Thinking. A Practical Guide to Systems Mapping" - article from the Kumu blog.

12-11-2024 update - Here's another KUMU systems map. This describes the problem of recidivism in Alameda County, California.  Click here to view the presentation.

9-29-2025 update - This KUMU map shows people who won INSNA awards in past years. It's an example of using KUMU for social network analysis.  View LinkedIn article.  View KUMU map.

5-13-2026 update - NodeXL has released a new version that enables you to import X (Twitter) data directly into NodeXL, using Apify to map conversations, discover influential voices, etc. See description in this blog article 

Monday, August 07, 2023

Support long-term mentoring.

 A couple of weeks ago I shared new research on mentoring in this article.


I hope you'll take time to read it. One of the key points was the  mismatch between how philanthropy funds long-term programs and the need for long-term programs to build and sustain relationships, or "who you know". 

Then take a look at this article, which includes the graphic shown below.


If we want to help more kids living today in high poverty areas move safely through school and into adult lives, with jobs that enable them to raise their own kids free of poverty, we must innovate ways to generate on-going operating dollars to a wide ecosystem of organizations in Chicago and other communities.

On Saturday I watched via ZOOM a  panel discussion from the STEMM Opportunity Alliance conference held in Chicago. One of the speakers used the term "Cathedral Building" to describe visionary work that will take many generations to complete.


I think my work is Cathedral Building, too.  Maybe it's impossible.  It certainly will take decades. This reminds me of an article I posted several years ago about the Tower of Babel, from the Old Testament

According to the Bible story God saw that men might work together to solve impossible problems and thus he gave them different languages so they could not communicate with each other.

But, is this God's will, or the will of people in power and privilidge, who are supported by religious leaders?  Below is an image from an article I read this weekend, titled "How we got stuck: The origins of hierarchy and inequality"


These are all related.  People in power don't want to solve the problems we face. They want to protect their positions of privilidge.  

I keep sharing the graphic at the right. If YOU are reading this you have the power to help change the future, just by sharing my articles, and my library, with your network, and the world.

Furthermore, you can read the articles I point to and form study groups, where others read and reflect on the same articles.

From this comes brainstorming and new solutions.  

While I've been sharing these ideas for over 20 years, too few people have ever seen them.  That's why it's not only important for you to pass them on, but for you to help me find one, or more, places that will collect my archives and use them for research, study, reflection and inspiration for the next many decades.


Will you help?

Connect with me on Twitter, Facebook, LinkedIn, Instagram, Mastodon and my blogs.  

Help me pay the bills, with a small contribution

Take ownership of these ideas. 


Wednesday, May 13, 2020

Covid19 draws new attention to Systems Thinking

Systems Thinking see here
This graphic shows a systems thinking planning cycle. You can see it and learn the steps involved, in an article titled, Covid-19 means systems thinking is no longer optional, written by Seth Reynolds, who's part of the team at NPC, a nonprofit consulting firm.

The author writes: 
Coronavirus illustrates the need to bring systems thinking out of the clouds and into the mainstream. We must learn to think, act, and organise systemically, and develop processes, tools and technologies to help us. We don’t claim that it’s simple. But what is clear from recent weeks is that ‘business as usual’ is no longer available and systems approaches are no longer optional.

I  have been writing about systems thinking for many years, as part of an information-based problem solving strategy that I launched in 1993 when creating the Tutor/Mentor Connection. Below is a concept map that includes a graphic from Gene Bellinger, a systems thinking expert. The cycle is the same.

View this map at this link

I wrote a long article in April 2015 where I explained my systems thinking ideas. Below I've posted just the first few paragraphs. Read the entire article at this link.

SunTimes front page
October 15, 1992
---begin 2015 article ----

Next week Chicago will elect a new mayor (or re-elect the incumbent) and will also elect some new aldermen. One of the issues is violence in Chicago. Shootings are up over the past year. They've been up and down for the past 25 years, as this front page from the 1992 Chicago SunTimes illustrates. In July 2014, the front page of both major newspapers featured “Violence in Chicago” stories. It's been an ongoing theme for a few years. In fact, This problem has been in the news off and on for over 20 years.

However, not much has changed.
Perhaps if elected officials were leading a “systems thinking” approach to draw stakeholders together, more people might become informed, and involved in solutions. We might find ways to keep people involved for many years.

Business and philanthropic leaders might apply the same process. For instance as The Chicago Community Trust celebrates it's 100th year anniversary, and holds its second annual On The Table event in May, they might have teams facilitating a systems thinking approach to reducing poverty in Chicago areas neighborhoods.

Problem solving is a cyclical process. A group of people get together to solve a problem and the solution leads to new problems that need to be solved, or new learning that leads to year-to-year growth in how the problem is being solved.

Here’s a graphic that I’ve borrowed from a video created by Gene Bellinger, who I met in a Systems Thinking discussion group on Linked-in.

As I view Gene’s videos, my wish is that someone were doing exactly the same presentation, but focused on bringing people together to solve some of the problems we face in Chicago, which are deeply rooted in poverty, income inequality, political power, etc.

I've hacked Gene's video to copy this graphic, then to create views of each element.

I'm using them to communicate an idea that I launched over seven years ago in a blog post focused on comparing the thinking and planning process that General's use to fight wars to what we need to be doing in Chicago to fight poverty and violence by providing stronger, on-going birth-to-work support systems for youth living in high poverty areas. Click on the graphic to enlarge it. Read this article for a full explanation of each step.

--- read the rest of this article at this link -----

Information based
Seth Reynolds is showing that the impact of #covid19 will reach into all sectors and all parts of the world and that it's time for a systems thinking approach that "must now be mainstreamed – individually, organisationally, societally, across public, private and charity sectors."

This process is based on an aggregation of information/data that is used to a) create a shared understanding of the problem; b) and a shared understanding of solutions that are being tried in different places that can inspire innovations in other places.

In the T/MC 4-part strategy
information collection is Step 1
In the 4-part strategy that the Tutor/Mentor Connection (T/MC) began using in 1993, Step 1 focuses on collecting "all that is known" about poverty, inequality, and youth serving, volunteer-based tutor, mentor and learning organizations, including funding streams, so that people everywhere can use this information to build and sustain needed k-12 programs in all places where they are needed.

It requires the same systems thinking approaches as Seth Reynolds outlines for this information to be used the way it was intended.

What I want people to think about is a) the work involved in aggregating knowledge from all over the world, sharing it via some technology platform (more than one), keeping it up-dated, then b) drawing more people to the information, and c)  helping them understand it.

Step 2 is a communications and marketing process that requires talented people and, ideally, a lot of money.  Step 3 is an education and learning support process.  Step 4 uses geographic maps to point people to places where solutions are needed.  Imagine thousands of small groups getting together to read my blog articles, or Seth's article, or information shared  on any of the  2000 links I point to in my web library. In Covid19, imagine people being asked to read a certain article, then meet on ZOOM to share their ideas, then write a blog article sharing their own understanding.

Information is at base of
this pyramid - view article
This work is not clearly itemized in Seth's article, nor in many of  the other systems thinking articles I've read. Yet it is fundamental to the success of any problem solving strategy.

At the left is a graphic that shows information at the base of a problem-solving process where the shared goal is that "more youth stay in school, are safe in non-school hours, graduate and move on to careers".

For this to be a reality in thousands of  high poverty places many need to be involved in the type of systems thinking process Seth has outlined in his article.  And there needs to be a web library, like the one the Tutor/Mentor Connection started building in the late 1990s, to support this process.

Read other Systems Thinking articles from this blog - click here.

Read how students in universities and high schools can take on the same role as I do in the Tutor/Mentor Connection/Institute, LLC.  click here

If this interests you let's connect on one of these social media sites.

5-15-2020 update - Thinking of the future after Covid19. On this website "IFTF offers the public—communities, policymakers, civic and business organizations—a guide to creating new visions of the common future." Apply this thinking along with the systems thinking process.

6-9-2020 update - Here's a Forbes article outlining some characteristics leaders of the future will need. These are "essential traits that enable systems thinking".  Click here to read.

6-22-2020 update - I've followed systems thinking articles by Brian G. Dowling for nearly 10 years. None are short, or easy to read, but if you take the time, you'll better understand the complexity of this work. Below is a Tweet posted this week, pointing to this presentation.
8-10-2020 update - SSIR article on "systems leadership" describes type of leadership needed to draw people together to solve complex problems.  click here to read.

6-11-2021 update - Map the System even, June 7-11.  Global conversation.  click here

12-14-2021 update - RSA article titled "What does regenerative thinking mean?click here

9-15-2023 update - Gene Bellinger shared three systems thinking models that he finds useful.  1) Kumu Community - https://kumu.io/community; 2) Insight Maker - https://insightmaker.com/explore  ; 3) The System Thinker - https://thesystemsthinker.com/  

9-15-2023 update - "How to Embed Systems Thinking in Education. Here's How".  The authors write "The recommendations from this pilot could help reignite imagination, creativity and innovation in the classroom, making learning more enjoyable and fulfilling for students."  click here

7-7-2024 update - here are two examples of mapping a network, using Kumu.io and  using coggle.it. Both show a "Better Together America Ecosystem".   a) the Kumu version: https://kumu.io/mesasebree/healthy-democracy-hubs-map#hubs/center-for-high-impact-philanthropy ; b) the coggle.it version: https://coggle.it/diagram/Zh7VvlCvDnguaLCL/t/better-together-america-ecosystem

8-13-2024 update - This Visual Guide shows "How to utilize NodeXL importers and further functionalities.  click here

9-30-2024 update - learn more about The Process of Community Network Mapping and its challenges. Interview with Aldo de Moor on the Greater than the Sum website. click here

Want to help cover my costs of maintaining the Tutor/Mentor Library and making it freely available to all?  Click here and use PayPal to send a contribution.


Friday, July 27, 2018

Wicked Problems. Getting 'Everyone" in the Room. Who cares?

For more than 40 years I've been trying to collect ideas and information that helped me be a more effective tutor/mentor, a more effective leader of a volunteer-based program, and to help well organized, mentor-rich youth programs reach k-12 kids in all high poverty neighborhoods of Chicago and other cities.

You may have read what I just wrote, but did you understand it the way I hoped you would?

I've been creating visualizations since the 1990s to try to create a shared understanding of the ideas and strategies that I was producing via the Tutor/Mentor Connection, and the single youth tutor/mentor program I was leading in Chicago.

These are embedded in almost every article that I've written on this blog since 2007 and in PDF essays I started creating in the late 1990s. You can also see them in print newsletters from the 1990s.  Below is a screen shot from my page on Pinterest, showing how I've aggregated some of my graphics on that site.

You can also do a web search for "Tutor/Mentor Connection" using Google or another platform, then look at the images feature. Many of the images you'll see were created by myself, or one of the interns who worked with the Tutor/Mentor Connection between 2006 and 2015.  You'll see maps that date back to 1994, created by volunteers and part time paid staff (when money was available for this).

One of the graphics you'll find is the one at the right, created by an intern from South Korea in 2011.  In this article you can see the original version of this graphic, created in the 1990s to visualize the T/MC's goal of connecting a growing number of people to information they could use to help individual tutor/mentor programs grow in all high poverty areas of Chicago, and to help each program constantly innovate better ways to help youth move through school and into adult lives.

On LinkedIn this morning I found a video by Marv Weisbord, a business consultant, that talks about evolution of business problem solving process since early 1900s. In the last eight minutes he talks about "getting everyone in the organization in a room to make a chart on the wall showing everything that has to happen for this system to improve."


He describes a point in the problem solving process where a problem is identified that no one in the room has a solution for.  He says, "They stop the process and ask "Well, who knows?" Then go out to try to find that person."

He concludes the video describing the evolution of group dynamics, or "getting everyone involved to improve the whole" and talking about how important this is in trying to solve some of the complex problems facing the world in coming years.

Read 11/14 article
This is the idea I've been focusing on since forming the Tutor/Mentor Connection in 1993. I use the analogy of the hospital operating room, as the forum with "everybody in the room".  As long as the people doing the operation know all they need to know, they don't need anyone else to join them. However, when a situation arises that they don't have an answer for, someone from the audience can say "I know" and be invited to join the team on the floor. If a question arises that no one in the room can answer, someone can say "I know someone who knows this. I'll bring them into the conversation."

At some point a question arises that has never been asked before. Then someone might say, "I'll do the research, and when I find an answer, I'll bring it to you."

I saw the Tweet below on my Twitter feed.


When Marv Weisbord, or anyone else, talks about "getting everyone in the room" I'm asking, "how do you know who is in the room, or who is missing?" 

One Section of T/MC Library
That should be part of the information we're collecting.  It's part of the knowledge based I've been building since forming the Tutor/Mentor Connection in 1993. Here's one page where I point to network analysis ideas.

In my introduction I wrote that I started creating visualizations because I feel that people who listen to what I say, or read what I write, have a mental picture, based on their own experiences, that may be different than what I'm trying to communicate.

Below is a presentation I created in early 2000 as "No Child Left Behind" was becoming the national education policy of the USA.  It illustrates how people have different mental pictures when the words "tutor and mentor" are used. Creating a shared  understanding is one step toward building solutions and long-term commitment to implementing those solutions.


I have been involved in this work for more than 40 years and have spent part of the past 25 years focusing on ways to get more people involved in helping build and sustain mentor-based youth and workforce development programs in all high poverty areas.

I've built a huge library of ideas.  I've created several hundred visualizations, like this "village" graphic, representing the range of people who I feel "need to be in the room" innovating ways to reach kids in every high poverty neighborhood with a range of actions that help each one move safely and successfully through school and into adult lives.

"It takes a Village to Raise a Child" - who is helping?


In the final portion of his video, Mr. Weisbord talks about "creating images of potential" rather than focusing on what's wrong, and how to fix it.

Maybe my maps and graphics are "images of potential".  What do  you think? 

I've never had enough resources and talent to ask and answer all of the questions that need to be asked, or to mobilize more than a few of "all" who need to be involved.

I'm now looking for a way to share what I've learned in a consulting role, or through partnerships with one or more universities who might carry this work forward in future years.  If you're interested in helping, or having a conversation, just reach out to me with a comment, or by connecting with me on Twitter, Facebook or LinkedIN.