This week I posted a new article on Substack.com that shows how I've been using GIG maps since 1993. I hope you'll read it. click here

I pointed to articles on the MappingforJustice blog, such as this one, that show examples of how I've used maps, and how others are doing similar work.
And, I encouraged universities, and others, to borrow from my history and build their own platform to support youth-serving programs in their community, and to help them reach more K-12 kids in every high poverty area.
So what is involved. Take a look at this concept map.

From left to right I show
a) boundary layers - city, zip code, community area, state and federal legislative districts, etc.b) indicators layers - poverty, violence, poorly performing schools, etc.
c) programs - while I focus on tutor/mentor programs, this could also show arts/science, or other types of services which need to be located close to consumers, meaning many are needed throughout the city. The programs layer can be sorted by age group served, type of program, time of day
 |
| sample map |
e) assets layers - in this section you can find sub sections for banks, hospitals, universities, faith groups, drug stores, and insurance companies, with offices/branches in different locations throughout the city.
 |
| sample map |
Ideally an updated version of the Program Locator would find ways to pull data on assets from resource files on the Internet, making this a continually updated feature.
Two features were never built into the program locator.
a) I wanted to be able to connect data from indicators into a form that program leaders (or donors) could use to determine the need for tutor/mentor programs in specific neighborhoods. Imagine clicking on a community area and getting a form showing number of kids; level of poverty, locations of existing programs, age group, type of program, etc. A program would just fill in their program information on the form and get a printed document to send to a donor. View this PDF to see how a map might show the number of kids in a community area.
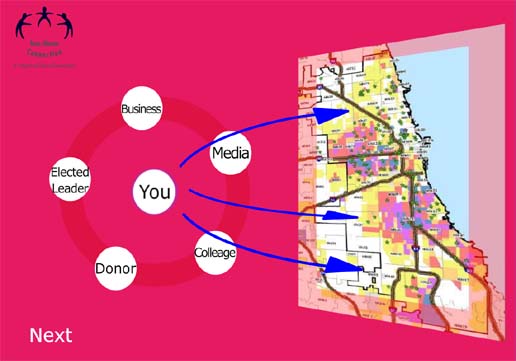
In another concept map I've been sharing links to platforms that collect and map data, shown all the places in the country where people need extra help.

Most of these show where help is needed, but don't host a directory of organizations who are trying to solve those problems. And, if a service needs to be close in order for people to participate, many such organizations would be needed in big cities like Chicago.
And they all compete with each other for scarce funding.
If you live in one of the cities where there are pockets of concentrated poverty and your newspaper headlines are showing "bad news" happening, why not reach out to technologists in your community or at your local university. Show them how I've been using maps and the Program Locator that was built in 2008.
Encourage them to build a similar resource for your community.
If you'd like my help, just reach out on LinkedIn.
That's just one place where you can find me. Visit this page to see my social media links.
And, if you want to help me pay the bills, visit this page.


 Posts
Posts


No comments:
Post a Comment