Showing posts sorted by date for query austin. Sort by relevance Show all posts

Tuesday, December 31, 2024

Into the new year

America lost a hero this week with the death of former president Jimmy Carter. 

I heard President Carter speak in June 2008 when I attended the National Conference on Volunteerism and Service in Atlanta.  His purpose, and the purpose of The Jimmy and Rosalynn Carter Partnership Foundation (JRCPF), was (and still is) to encourage the growth of campus-community partnerships and student-led community service learning.  

I wrote two blog articles in 2008 in the weeks after hearing Jimmy Carter and I've mixed them together in the message I'm sharing today.

President Carter talked about the gaps between rich and poor, and then demonstrated what he is doing to close this gap by providing awards to three university-community engagement projects.  

He said "the greatest challenge we face is the gap between rich and poor." And, "We have the best institutions of higher education in the world, yet many are surrounded by slums."

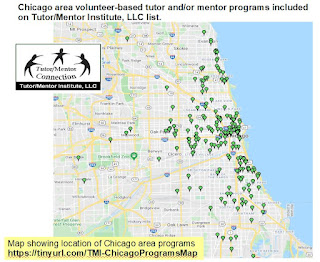
I created the graphic below as I attended workshops focused on business and university engagement. It includes a map of the Chicago region, showing areas where poverty is concentrated and were youth, families and schools need more help.


In 2008 I'd already spent 14 years trying to reverse the traditional two-way process of how nonprofits obtain resources from people who already have a self interest in wanting these nonprofits to be successful in their missions. We'll never have great social benefit programs in a majority of the places where they are needed based on the current system of competitive allocation.

Yet, if we can engage the talent of volunteers and leaders to serve in intermediary roles, we can do more to connect people who can help with places where help is needed.

I put these and similar charts on the T/MC web site with a goal that they are used by groups of people in universities, churches, businesses, etc. who want to become more strategic, and more engaged, in the ways they use their talent, time and resources to help end poverty in Chicago, and other cities around the world.    

I wrote a second article after hearing President Jimmy Carter say "We have some of the best institutions of higher education in the world. Yet many of them are surrounded by slums."

I included this map showing locations of colleges and universities in the Chicago region,  with overlays showing where poverty was most concentrated and where poorly performing schools (based on 2007 Illinois State Board of Education) were located.

Its aim is to help students, faculty and alumni from each university create tutor/mentor support groups that adopt the mission and strategy of the Tutor/Mentor Connection (led by Tutor/Mentor Institute, LLC since 2011) in their own efforts to help volunteer-based tutor/mentor programs grow in the areas around the college or university.

Thus, if you're at Northwestern, or Loyola, you could have a great impact on the growth of programs in the North part of Chicago and in Evanston. While if you're at the University of Chicago, you could have an impact in helping tutor/mentor programs grow throughout the South Side where our maps show so much poverty and too few tutor/mentor programs.

If you're at Dominican University in Oak Park, you could be supporting programs in Austin and on the West side of Chicago. If you're at the University of Illinois at Chicago, you could also be supporting the entire West side. And, if you're a downtown campus, with students and alumni living in all parts of the region, you could use these maps, to develop engagement strategies throughout the region, using the expressways as routes to connect with programs in different neighborhoods.

You could have a page on your website showing how your students were collecting and sharing information about what tutor/mentor programs in your part of the city were doing, and what universities in other parts of Chicago, and in other cities, were doing to help youth in high poverty areas of their cities. You could even be hosting conferences and online forums to share this information. View this intern blog to see examples of what's possible. 

As you look at these maps, use the Zip Code Map and Chicago Programs Links, to find contact information for organizations that provide various forms of volunteer-based tutoring and/or mentoring. You can narrow your search by type of program and age group served by using the Program Locator database (which was built in 2004, but is now only available as an archive).

You'll find that some programs are very well organized. Some are small, and may not be so well organized. Some places just offer homework help. Some offer a rich learning environment and connect youth to a wide network of adults and opportunities.

However, the goal is not to pick and choose between different levels of program quality. It's to help develop great volunteer-based tutoring/mentoring and extended learning programs in every zip code with high poverty. That may mean helping a small program grow. It also means helping the best programs continue to sustain their work.

It means we need to build a distribution of manpower, talent, operating dollars and technology into every poverty neighborhood, not just a few with high profile leaders.

The Tutor/Mentor Connection was created in 1993 and has been led by Tutor/Mentor Institute, LLC since 2011. It's aim is to share information so that teams in universities begin to develop their own ideal of what mix of services and what type of program structure is best, and that they begin to take on a responsibility for helping such programs grow in the area around the university, with a goal that elementary school kids they work with today can be college freshmen in 6 to 12 years, and college alumni who support the university, and its neighborhood tutor/mentor programs, 15 to 20 years from now.

Read this "Tipping  Point" article to see a description of this vision. click here


The result of such leadership can be that instead of wealthy alumni donating $20 million for research at an area university, these same alumni might begin to divide that money into annual grants of $40,000 to $80,000 that would provide operating support to volunteer-based tutor/mentor programs in the area around the university, using the web site of the organization, and the recommendations of the university, to determine which groups to support. It also means that thousands other donors will contribute their own time, talent and dollars to support the on-going efforts of programs in different parts of the city and suburbs.

That was a long term vision when I wrote this in 2008. It's still just a vision.

It requires many leaders in many organizations and communities. This is why I think some of this leadership should be anchored in universities who have long term commitments to their neighborhoods and the city of Chicago. Through these universities we can engage other teams of volunteers, from hospitals, businesses, civic and social organizations. (I'll write about the role of hospitals, faith groups and businesses in a different article.)

This is not something you can wait for the other college or university to take ownership of. It's a form of leadership and engagement that a student, alumni, professor or administrator can launch from their own blog or web site.

We even created a template of a strategic plan that you might use to start your thinking. We've created a Business School Connection to show how students from the business schools of our major universities could use the skills they are learning to mobilize volunteers and donors for area tutor/mentor programs.

Since 2008 I've created other visual essays to encourage universities to create on-campus Tutor/Mentor Connection strategies.  See them in these articles.

As you read the paper this week about another shooting in Chicago, or about some leader promising new hope for America, I hope you'll look in the mirror and say, "Solutions to America's problems start with me."  That's what Jimmy Carter did. 


Thank you for reading and sharing my blog articles.  I hope you'll connect with me on social media (see links here) and help build an on-line community of people who discuss and share these ideas. 

And thank you to those who made 2024 contributions to help fund the Tutor/Mentor Institute, LLC.  If you did not contribute this year, please make a donation in the coming months.  Visit this page for details. 


Monday, February 07, 2022

Mentoring Connections - Over Many Years

If you've read many of my articles you know I advocate for the growth of long-term volunteer-based tutor, mentor and learning programs that reach youth in high poverty neighborhoods. My passion comes from leading such a program from 1975 to 2011 and from the many long-term connections I've been part of. 

Below are a few photos that illustrate this.

Me and Leo Hall - 1973 till 2022 - Leo and I were matched in 1973 when he was in 4th grade. We've stayed connected since then. We're now connected on Facebook.  View past articles where I've talked about Leo and myself.  Leo's now looking for a Kidney donor. If you think you can help reach out to me on Facebook. 


Allen Tyson and Victor Dawson - 1975 till 2022.  Below is a set of photos that Victor posted on Facebook last week.  The three on the right are from the year-end yearbooks that I created every year from 1974 to 1991.  


Allen has actually been involved a year or two longer than myself.  He has had a series of mentees, including Victor's siblings, over the past 50 years.  Here are a few articles where you can read about Allen and past mentees.  


Chris Dowdle and Tangela Smith Marlow - late 1980s till 2022. Below is a Facebook interaction in February 2021 between Chris and Tangela.  They met in the original program at Montgomery Ward, then joined Cabrini Connections in 1993 when Tangela aged out of the original program. Chris's husband, Ray Dowdle, with the long-term board president of Cabrini Connections. 


Alberta Duff and Cindy Hene.  1980s till 2022.  This is part of a Facebook conversation started by Alberta in 2021.  She asked if I knew who her past tutor was before the Cabrini Connections program.  I looked in yearbooks from the late 1980s and found the photo of her and Cindy, then looked for Cindy on Facebook. I then re-connected them.


View the yearbook archive.

Victor has had several of the yearbooks from past years and a couple of years ago I shared this link where anyone can find the entire collection from 1976 to 1991. Visit this page and you can find links to newsletters from 1993-2003 from the Cabrini Connections - Tutor/Mentor Connection, as well as annual reports from those years. 


When Victor posted some photos of him and his Cabrini-Green friends and family recently I skimmed through them and did not recognize any faces after so many years. So I suggested he look at the old yearbooks and put pictures from the past with those of the present.  He did that.

I also suggested that others look up their former tutors.  Kimberly Smith found photos of herself with two of her former tutors and posted them the the Facebook conversation.


Tramaine Ford accepted the invitation too,  and posted the photos below to Facebook. He received responses from Carrie Clifford and Gloria Harrison, who he met when they launched the Innervisions Youth Productions video creation group at Cabrini Connections in 1997.  


These are just a few of the connections taking place today, in 2022, that were started through the tutor/mentor programs I led from 1973 to 2011.  They show that the work we did in past years to help build and sustain these relationships are still paying dividends today.  

I'm connected to each of these former students and many others on Facebook and delighted when I see them posting stories telling of the success of their own kids.  I'm also saddened when I hear of tragedies that continue to plague others.

There are very few organized tutor/mentor programs in Chicago that have longer histories than 20 or 30  years, but there are some.  The program I led at Montgomery Ward is now Tutoring Chicago and can probably offer many stories of these on-going connections.  The Chicago Lights program at 4th Presbyterian Church and the Custer Tutoring Program in Austin are also long-term programs. 

Each green icon on this map is the location of one of the tutor and/or mentor programs on a list I host. Find the map and list at this link.  Browse through the list, look at the websites, identify other long-term programs and/or unique mentoring models, then share stories of these programs with your friends, family and co-workers. Help each program attract the resources needed to build long-term connections. 


Create your own map stories.

I've plotted the location of Chicago area tutor and/or mentor programs on maps since 1993 and created overlays showing indicators of where programs are most needed, such as high poverty, poorly performing schools and/or incidents of violence.  

Use this information to create your own map-stories that draw attention, volunteers and donors to programs in different parts of Chicago.  Browse the list of map-based articles on this blog, or the MappingforJustice blog to see how I've embedded maps in stories. 

Increasing attention. Sharing information.

I hosted Tutor/Mentor Leadership and Networking Conferences in Chicago every six months from May 1994 to May 2014 to help programs learn and share from each other, and to draw media and donor attention.  I've used my newsletters, blogs, social media and websites to encourage every program to constantly learn from each other, and to share their own stories of what works, what challenges they face, and how their students and volunteers are still connecting after many years.  

I've  used articles like this to encourage programs to share more information on their websites and to create and use blogs. I feel such information would provide more evidence that donors, volunteers and parents might use to choose programs to support or get involved with.

However, more people need to encourage this than myself, especially donors.   

Add your photos. Rebuild connections.

If you're part of the tutor/mentor programs I led I encourage you to go through the old yearbooks and find photos of yourself and your tutor or mentee, then share them on Facebook with myself and each other. In doing so you show the value of these programs and encourage donors to support existing programs that are doing similar work.  And, you help re-build and strengthen the ties that bind us. 

Are you part of other programs? Tell your own stories.

If you are connected to other tutor/mentor programs in Chicago or in other cities encourage them to share stories showing the connections that still exist between former students and volunteers, or the successes alumni are having because of the help the programs provided in the past. Use Facebook, Twitter, Instagram and LinkedIn to get the largest possible attention for your posts, and for these organizations. 

Together we can draw greater attention to programs that support long-term connections and help them attract the volunteers and donors needed to help those programs operate from year-to-year.

Thanks for reading.  

I hope you'll connect with me on one of these social media platforms. 


Friday, November 05, 2021

Use To&Through data tool to access community areas

In a few recent articles I focused on using maps and community area data to build an understanding of how much extra support youth in different areas need to move safely through high school, post high school education, then into jobs and careers.

See articles here, here and here.

Yesterday the University of Chicago Consortium on School Research's  (click here)  To&Through Program  (click herereleased a new To&Through Community Milestones Tool, which they describe as "a first-of-its-kind interactive data tool that organizes data on CPS students' attainment by the community area in which they live rather than the school they attend."

In my articles I focused on Chicago community area level planning.  In the To&Through Project's interactive dashboard they apply the same lens.  You can sort the report by community area and find demographic information along with school graduation and college attendance rates for each community area, and for demographic groups within each community area.  I show the Austin area in the graphic below.


Here's a link to the 11/4/2021 webinar where they introduced the dashboard and research paper.  Additional webinars will be held on November 9 and November 17.  I encourage planners to watch these and learn to add this data tool to others they use in building an understanding of community area youth development needs.

During the introduction of the webinar the slide I show below expressed a recognition of the need to "Expand accountability for improving students' outcomes and addressing enduring disinvestments in communities of color."  
This is what I've been focusing on for the past 25 years.  More people need to be looking at this information, then sharing what they are learning with others, so more and more people get involved. 


That process needs to continue for a decade or longer so that teams of people form to support the growth of birth-to-work school and non-school youth support programs in all of the community areas where data shows they are needed most.

And that growing interest needs to manifest in a growing flow of dollars into EACH of the high needs community areas, supporting schools and non-school tutor, mentor, jobs, youth development and learning programs.


I hope you'll look at the To&Through Project dashboard and take part in the work needed to help the most underserved communities get more of the resources they need to help more kids from birth-to-work.

Connect with me on one of these social media platforms and help spread this message to more people and places.

If you're able to make a contribution (not tax deductable) to help fund the Tutor/Mentor Institute, LLC, click here.  

Or support my 75th Birthday campaign. Click here


Tuesday, November 24, 2020

Thanksgiving 2020 - Thoughts about Maps

I'll be at my computer on Thanksgiving 2020, just as I am today. I'm making an effort to connect people who can help with information and ideas they can use to help bridge the divides in America, to create greater opportunity for all. 

During the past year as Covid19 and the continued killings of Black men and women by police in America have exposed long-standing inequities, it's more important than ever to mobilize people's time, talent, dollars, votes and commitment to bringing solutions to every place where maps show inequality. 

In January 2019 I attended the Chicago Opportunity Zones event held at the new Malcolm X College in Chicago. I joined with a few others using Twitter to share what I was hearing, so visit  #LiveatUrban and scroll through the Tweets to learn more about the Opportunity Zones (Called "O-Zones" by one speaker. A term I use often below.)

The final speaker was the new President of The Chicago Community Trust, who in the Tweet I've posted below said “Now is the time of action. We can't let perfect be the enemy of good.”


To me, part of those actions is doing the research and learning, to identify places where people need help, and to offer time, talent, dollars and other types of support to organizations and businesses in those areas.

One panel was moderated by Derek R.B. Douglas, Vice President for Civic Engagement at the University of Chicago. In his remarks, he said, “The biggest thing we have to do when we leave this room is form the partnerships and connections to get to work.”


Since 1993 I've been trying using maps to help people form those "partnerships and connections". Maps can be used to focus attention on places where people in Chicago need extra help, so the first thing that came to my mind was “What neighborhoods are affected?” And, “What indicators were used to show these areas need this government supported capital investment?”

Below are some examples of how maps can be used. In this case I'm focusing on the Opportunity Zones announced in January 2019. 

The Opportunity Zone map is shown at the right in the following graphics. In the first map I've used a demographics mapping site  to show Chicago. The green color shows areas with a high density of African Americans. By comparing the O-Zone map with the one on the right, you can see that the Opportunity Zones are targeted to help this sector more than others.


This next map shows the Chicago Tribuneshootings tracker” site, which shows locations of Chicago shootings for past 365 days. There's a definite overlap with O-zones but there are other areas which also need investment.


The next map comes from the Casey Foundation's Community Opportunity Map which shows poverty levels in Chicago (and other parts of the country). Using the interactive map you can focus in on specific parts of the city, and generate tables of information. For instance, I created a view focused on the North Lawndale area.


This next set of maps shows non-school youth tutor and/or mentor programs in Chicago, based on a list I've been maintaining since 1994. While most of these are not-profit centers that would attract Opportunity Zone investment, they are part of the mix of youth and family support organizations needed to help bring a neighborhood out of deep poverty.

View Tutor/Mentor Programs map here

A closer inspection of my map would show the wide range of programs on the map, and the lack of these programs in many of the O-Zone areas.

So who are some of the potential stakeholders and resources already in these neighborhoods?

On the graphic below I've zoomed into the O-Zone map to focus on the North Lawndale area of Chicago's West side. Then, I used the Chicago Health Atlas Map to focus on North Lawndale, and show hospitals serving this area.


Hospitals can be employers, can be customers for products and services produced locally, can provide needed health services, and can be conveners who bring stakeholders together. They can also be leaders who help comprehensive youth tutor/mentor programs grow in the area. Using the Chicago Health Atlas you can also create maps showing health disparities, which are indicators of investments needed in different areas of Chicago.

There were only a few maps shown the January 2019 Opportunity Zones presentation. One showed investment flows in the Chicago region. That map is shown in this tweet. Notice how the areas with the greatest investment, are just the opposite of those the O-Zone focuses on, which  have the least investments flowing into them.


In the concept map below I point to the platforms I used to create the maps I've shown. These are just a few of the growing number of data mapping resources becoming available over the past few years.

Open map at this link

Creating, maintaining, and motivating others to use these platforms offer many challenges. Among these are:

a) Motivating and teaching people to use the various platforms to create maps that focus a story on specific places. That's what I did in the above maps.

b) Locating the different platforms with needed information can also be a challenge, at least from a time perspective. In many cases the data-maps are no longer on-line, so when I open a link it is a dead end. Unless people are really motivated, most won't do the digging needed to put together an effective map story.

c) Building public awareness so more people look at the maps, use them in planning and action steps that bring people together and drive needed resources to non profits and growing businesses in specific areas is also a challenge. People creating the map platforms usually don't have advertising dollars to do the communications needed to attract people to the maps, or to teach others to use the platforms to create on-gong map stories.

These data resources are not profit centers. Thus, they don't qualify for investment zone capital. One role of philanthropy, or other government resources, could be to support the development, constant maintenance and updating, and long-term use of platforms like this.

During the event one speaker said there are already community planning resources. Why not use them to guide investment? I Tweeted out LISC Chicago as an example of this.


Below is a screenshot is from one of 27 quality of life community plans developed under the lead of LISC Chicago. It shows the Austin Community area. All 27 can be downloaded at this link.

Download at this link.

I don't include it on my data map because it's in a PDF, and not an interactive, on-line map (according to LISC Chicago). Thus while it's a great map, it's only useful to those who have access to it. You can't add layers, or zoom in, to focus on specific areas, or turn it into stories. There may be other map platforms like this in Chicago, or in other cities. I'm always adding to my library and this concept map. Send me links if you have them.

In my own efforts between 1994 and 2011 I tried to build one platform that would provide many layers of information that could be used to support neighborhood based planning intended to make more and better youth serving programs available in high poverty neighborhoods.

Example of map view created using
Tutor/MentorProgram Locator

The map of the left was created using  the Interactive Tutor/Mentor Program Locator's Asset Map section.

It's no longer functioning properly, although still can be seen on-line.

While I've been collecting and mapping data since 1994, for most of those years I was dependent on volunteers and donated software. In 2007 a $50k anonymous gift, combined with a grant from HSBC North America, enabled me to re-build our in house mapping platform, and to build the on-line interactive platform.

Using ARC GIS software we could create maps showing layers of information and using the interactive platform, we enabled others to create similar maps. Below are two examples. You can see more like this in the MapGallery created in late 2010.


Unfortunately, the recession, starting in 2008, dried up funding for this by mid 2010.  I've not had funds to update this or create these maps since 2011, and it would take a significant investment to rebuild my capacity.

Yet, I feel it is needed because I don't find any other mapping platforms combining all the layers I was trying to combine, and building it into blogs and on-going communications, so community planners could show the need, show existing service providers (and/or businesses) and show assets in, and around, the community who should be involved in any planning process.

I wrote an article earlier this year showing the layers of information needed on a platform like the Tutor/Mentor Program Locator - read it here

I also added an interesting article about building relationship networks to support philanthropy. You can read it here.  Such networks could be using the mapping ideas I've been sharing.

Thus, if part of your Thanksgiving weekend involves researching places where you can make a difference, perhaps you can read some of the articles on my blogs then share them with others who might want to become the investor, partner or benefactor who rebuilds the Tutor/Mentor Connection and its on-line mapping, and makes it freely available for others to use in Chicago and cities around the world.  

Or, you might be a creative social entrepreneur who can figure out how to generate revenue and profit from this, so we could seek capital investors from programs like the Opportunity Zones program.

Maybe you can help me be part of some of those "partnerships and connections" Derek Douglas talked about or that you will read about in the philanthropy article I pointed to above.

Or maybe you'll make a contribution to my 74th birthday campaign or my annual fund the T/MI campaign.

I'm on Twitter, Facebook and LinkedIN. I'll look forward to connecting with you.

Monday, June 08, 2020

Athletes Can Take The Lead

Last Sunday I posted a "do the planning" article after watching protest marches take place across the country and around the world. I emphasized that long-term leadership is required to solve the problems we face. Today's Chicago SunTimes provides the inspiration for this week's article.

Below is a photo from the sports section, showing athletes from Chicago pro sports teams who met with youth in the Austin neighborhood of Chicago last week.

See photos in 6/8/2020 Chicago SunTimes - click here
I have posted 35 articles over past decade showing a greater role that athletes and celebrities can take to motivate their fans to give time, talent and dollars to support youth-serving organizations in different neighborhoods of Chicago. This will be number 36.

My articles focus on the mental part of building a great team and the consistent long-term work required.  Most sports teams have thick play-books that coaches use to train athletes to work together to defeat opponents.

Build a game plan for ending racism & fighting poverty. 
In my articles I urge the development of a game plan, with blueprints showing work needed to support youth at every age level, as they move from birth to adult lives, jobs and the freedom to live anywhere, without worry for the safety of themselves or their kids.

Adopt a Neighborhood

The map at the left visualizes my goal that athletes adopt specific neighborhoods for one year of support (which can repeat in future years).

During that year they will use media opportunities to talk about their neighborhood, it's needs, and how fans can  help every youth serving organization become great, by having the support needed to build great youth development, tutoring and mentoring teams.

Instead of supporting a single program in one area, they draw attention to every program within their adopted neighborhood, and lead planning efforts that determine if there is a need for more programs in that area, or for more of specific types of programs.
Youth need support at
every age level

What if every athlete in the SunTimes photo at the top of this article had a blog, and on that blog they were writing their own versions of articles I've posted for the past 15 years on this blog? Would more people be reading them? Would more be inspired to act?

Every athlete could be talking about the many years of hard work needed to reach a pro career, and the coaches who helped them along the way.  They could also do more reflection, asking "Who paid the bills, and raised the money, so these coaches could be a consistent part of their lives for many years, and so there would be high schools, colleges and pro sports franchises where they could grow their careers?"

Below is another graphic they could write about. It's included in this article. Every athlete could create their own version of this, and share it in a variety of formats. Then they could meet and share ideas, in "coaching clinics" so each builds better game plans from year-to-year.

Inspire volunteers from different industries to support growth of programs in every zip code.
My articles and graphics emphasize the 20-25 years it takes for a child to grow from birth to work, and how programs supporting this growth need to be available in every high poverty area of Chicago and other cities and zip codes.

Athletes could create their own versions of these articles. They could also inspire fans to create new versions. They could inspire (and fund) programs that encourage youth to dig into my articles then create their own interpretations (see how interns did this from 2006 to 2016).

Right now athletes and coaches are meeting via ZOOM and athletes are studying playbooks from the safety of their homes.

My blog is a playbook! So is my website

  
adopt a neighborhood

Finally, what if there were an end-of-year awards event, hosted by President Obama, Oprah, LeBron James, Magic Johnson and other leaders, to recognize the work athletes did during the past year to support neighborhoods and help youth programs grow.  Give athletes the stage and let them boast of their work.  Aggregate websites that show game plans, so that as the event draws millions of viewers it also provides fuel to support a new year of the same work, done better because each athlete is learning from the work done by others.

If you read this, share it with athletes and sports writers. Maybe one will pick up this challenge and provide the leadership to get others to adopt it.

Keeping attention focused on the problem and on solutions that need to be applied in thousands of places is the challenge we have failed to meet for the past 60 years. This is a strategy to meet that challenge.

NOTE: as you begin to think of visualizing current problems and solutions I suggest you read this article by Steve Whitla. 

Visit this page to see where you can find me on social media.

Visit this page to make a contribution to help fund my work.


Friday, February 21, 2020

Maps, Planning, Network Building

I have been trying to harness the power of geographic maps since 1993 in an effort to support the growth of mentor-rich, non-school, youth development programs in every high poverty neighborhood of Chicago. Below are two news stories that illustrate that commitment.
At left is an article from the 1994 Chicago SunTimes; At right a Nov. 2015 Chicago Tribune story
My goal has been that leaders in business, philanthropy, media, politics, etc would use maps, and the information library I've been building since before the 1990s,  in planning that would support existing youth tutor, mentor and learning programs and help new ones start where more are needed.  Below is a concept map that visualizes this on-going map-based planning.

Using maps  in planning cycle - see cMap
Over the past few months I've been attending meetings hosted by Chicago's Mayor Lightfoot, focused on making non-school learning opportunities available to every youth in Chicago, particularly those that are most difficult to reach.  In these meetings the planning process being used by the Chicago Learning Exchange, and the Austin Coming Together group have been featured.

At the left is one map from this report, highlighted in this Northwestern University School of Education and Social Policy article.  The map is part of an analysis of the availability of computer sciences programs in different Chicago community areas and shows places in the city where no known CS programs exist. It's one of many maps in the report.

The Austin Coming Together group has has been using maps like this in their own Quality of Life Planning.  Read the reports on their website and you'll see numerous examples of maps being used as part of the planning process.

As I attend meetings and connect on social media I'm sharing ideas and I'm learning new strategies and technologies that can be used to help build larger and closer on-line communities of people who focus on common issues.

I attended the Chicago Learning Exchanges Computer Science Affinity Group meeting on Thursday and at the start of the meeting the facilitator said "let's get to know who is in the room".  In most gatherings I've attended this involves people standing and giving their name, organization, and a short introduction. At #ChiHackNight that is limited to three words!

That was not the case yesterday. We were invited to log into a Mentimeter site from our phones, tablets and PCs and enter a six digit code, then answer questions that asked who we were, what organization, our goals, etc.  Below is a Tweet I posted with a screen shot of one of the reports generated which were used by the meeting facilitator to help people know more about each other.

If I get slides from the meeting that show the Memtimeter information I'll update this blog with those.

The Mentimeter site reminds me of Group Systems meeting facilitation software that I was first introduced to in the early 1990s, and which probably influenced my passion for on-line interaction.

The text below is from a document titled "Best Practice in Facilitating Virtual Meetings" which was published in 2000.

click to enlarge

It enables "everyone to "talk at once" and makes all contributions available to other participants on their own terminals. The way comments are aggregated is similar to what Mentimeter does, and enables meeting leaders to help meeting participants quickly see where they agree, and where they disagree and more conversation is needed.  Read the entire article to learn more.

When I was working with Group Systems consultants in the late 1990s, the on-line versions of these tools were not available, and people were not yet gathering in online communities or social media sites. Yet the potential for large numbers of people to be contributing their own ideas to making Chicago a better place for everyone to live, has always driven my work.

How can one person change
the world? 


The graphic at the right is one I created more than a decade ago to visualize how a small group of people could change the world, if they could spread their ideas to more and more people who had the mix of talent and resources to implement their ideas.

I've never had advertising dollars so using social media and traditional news media have always been part of the strategies I've employed.  However it's really difficult to measure your impact.

I only have a few people giving me financial support now, since I've not been a 501-c-3- non profit since 2011, and a few are asking "what are you accomplishing?"

I feel that just maintaining an information library and making it freely available to the world is quite an accomplishment.  However, getting more people to find and use it is a huge challenge.  So I keep looking at tools that show network growth and my influence within a network.

Here's a Tweet that came across my desk this week.


This was looking at Tweets posted yesterday morning around Mayor Lightfoot's ChiSTEPSummit held yesterday in Chicago.  I was not there, but was connected online. Open the link to the Tweet Binder Report and it provides a fascinating amount of information about participants in that conversation, including my @tutormentorteam Tweets.

I've not yet had time to learn more about TweetBinder or Mentimeter but both look like useful tools to those who seek to bring people together to solve complex problems and who are looking for tools to help them understand who is gathering, and who still is missing.

I hope you will look at the examples of using maps in planning, along with these analysis tools, and will find them useful.   If you're interested in helping me apply them via the Tutor/Mentor Institute, LLC, let's connect.


Wednesday, January 29, 2020

MyChi. MyFuture. Feedback.

As the Tweet below shows, yesterday I attended the citywide meeting of Mayor Lightfoot's EveryKidConnected initiative, which was launched last October. Since then the hashtag has changed to #EveryYouth Connected, and may change again.

As the meeting ended I encouraged the others at my table to use their blogs to share their own ideas for next steps for this initiative.  Mine are below.

In this next Tweet I'm sharing the mission statement developed at the January meeting.


As I said in the Tweet, that vision is what I feel describes a total quality non-school tutor/mentor program.  The graphic below is shown in this presentation. It visualizes the growth of organized, non-school, k-12 youth programs, available in every high poverty neighborhood, with a wide range of age-appropriate mentoring, enrichment and learning opportunities.

Building a learning distribution system - read more

How we get there is what needs to be worked out.  Below are some of the ideas for generating public awareness and involvement that were shared at my table.

The MyChi.MyFuture media campaign is planned to launch at the end of March. The costs of a comprehensive tops-down campaign could be huge, thus efforts that generate free communications from people and organizations throughout the city should be a priority, now and in the future.

1) - So far there is little communications from the leaders of the initiative on Twitter, using either #everykidconnected, #everyyouthconnected, or #MyChiMyFuture.  I received an email follow up yesterday, with the PDF of the slides from the presentation.  If that had been in a Tweet I could have already shared it with my own network.  Using Facebook, Linkedin and Instagram in the same way should be strategic. (see more social media ideas below).

2) - Encourage organizations throughout the city to blog their understanding of this initiative, as well as their part of the process, as well as services available to youth in their own programs and/or communities. Bloggers could be faith groups, elected officials, businesses, non-profit youth orgs, schools, etc.  Once blog articles are written they should be shared in social media, using a hashtag launched by the leaders of the initiative.  

#clmooc 

I have written numerous articles on this blog showing my engagement with the Connected Learning #clmooc community on social media. I urge leaders of this initiative to spend time studying these, to see ways they can use these same low, or no-cost, strategies to connect people, organizations, resource providers and youth throughout Chicago with each other.

3) - Enlist students and parents as communicators. 

The Parent Mentor Program was mentioned as one example where parents are already working to help build relationships between parents, teachers and students. Such groups could be learning about non-school opportunities and existing programs and communicating those via their own efforts. Below I show Tutor/Mentor Connection/Institute, LLC efforts to aggregate and share information. Someone should be aggregating information about parent groups who could be sharing MyChi.MyFuture information and supporting youth involvement in different parts of the city.

Enlist students as story tellers.  During National Mentoring Month youth have been posting #ThankYourMentor stories.  This could be #MyOutOfSchoolLearning experience or #MyChiMyFutureLearning experience. It could also be #HowISpentMySummer  or #MySummerLearningExperience. As youth become engaged they could suggest new  hashtags, and themes for future communications and interaction efforts.

Participation maps such as this from the 2017 CLMOOC could be used to show places in the city where youth are creating messages for this campaign, and to show locations of non-school learning opportunities.

Use maps to assure youth in every part of Chicago have opportunities

Enlist students via classroom learning activities - Here's one of many blog articles where a middle school educator from Massachusetts shares work his students are doing.  If during spring 2020 educators were encouraged to develop a back-to-school activity where students used blogs, videos, social media, games and other forms of communications to share #MySummerLearningExperince or #OutofSchoolTimePrograms in my neighborhood, which were then aggregated and shared on blogs like Kevin's, this could launch thousands of stories from September 2020 to May 2021 (and beyond) to help the MyChiMyFuture initiative grow and reach all Chicago youth over the next few years.

Tutor/Mentor lists on Facebook

4)  While MyChi.MyFuture is attempting to create a master list of out-of-school-time opportunities I feel it should point to existing lists, such as the ones I point to from this concept map. I'm sure there are others that I'm unaware of. Collectively these will always have more information that what any single intermediary is able to collect and keep updated.

5)   To  help draw attention to existing providers and help them connect and learn from each other, MyChi.MyFuture should a) create a profile on Twitter, FB, Linkedin, etc. then use the list feature on Twitter, and Notes feature on Facebook, to create one of more lists of Chicago programs.  (It could create one master list, or could create lists for sections of the city, North, Central, South Central, Far South) as I do in the Tutor/Mentor Programs Directory.

Here's my TMPrograms list on Twitter. Here's my Facebook list of Chicago programs and intermediaries.  If MyChi.MyFuture were to create its own lists, people visiting their account could scroll the list to learn about existing programs via the information they posts. Donors and volunteers could learn to use this to find programs in different parts of the city to support. Parents and youth could learn this to find opportunities.

6)  - Recruit volunteers from advertising, PR, technology and other communications companies to mentor youth and teach them ways to tell stories via multiple media. At some point in the future maps should be showing icons throughout the city where people from each industry are connecting with youth.  Programs should show that multiple industries have volunteers working at their sites, not just in direct service, but in helping programs communicate their stories, their lessons and their challenges.  Many companies should be doing this as part of on-going, formal, workforce development strategies.


7) - Focus on connecting intermediaries like the Austin planning group, to others throughout the city, so they can learn from each other.  Below is a concept map showing the planning process that should be on-going in every community area.

Planning is an on-going cycle, focusing on a specific geographic area. read more
One of the roles of the leadership of MyChi.MyFuture is to identify the various stakeholders and share that information in ways that encourage conversation, interaction, learning and shared efforts among the various organizations.  Below is an example of how I've been doing that.

Intermediaries focused on youth in Chicago - cmap
Youth in various schools and non-school programs, local colleges, or any other group could be creating similar maps showing local organizations, intermediaries, etc.  Note that I point to the web sites of each organization on the map (if I have a link).  This information is published in my blogs, website and social media to encourage programs to connect and learn from each other.

8)  How will you measure this?  How will you quantify the number of youth in each neighborhood who most need these programs? How will you show how many participated during the summer, or during the school year? How will you share that, at the neighborhood level, to support on-going planning and program growth?  Below is a Slideshare pdf that shows the number of youth, age 6-17, and the number of high poverty youth, in each community area.  

Every Youth Connected implies that 100% of the youth in each area will participate in one or more learning experiences in the summer and in the school year.  That is a significant challenge, both from the planning perspective, and from the funding perspective, since right now there are so few program slots available in many areas of the city.

I've been sharing ideas like this on this blog since 2005 and on websites since 1998. I hope some of the people involved in this new initiative will take the time to look and want to have me help them understand and apply these ideas.

You can find links to my social media sites at this page.