Every month I see a new report showing the impact of concentrated poverty on school performance, health, economic well-being and other issues. Last year
A Better Chicago released a new report titled "
State of Chicago Youth, 2025". I wrote about it in
this article. They issues an update in 2026 -
click here
Below is a message I've shared often, in different articles, for the past 30+ years.
I’ve been collecting similar information since I became a volunteer tutor in 1973, showing where people need extra help, why, and what type of help could be offered to youth via organized, on-going, volunteer-based tutor/mentor programs.
From 1993 to 2003 I shared this information via printed newsletters. Then on a website since 1998. I’ve been pointing to that research in articles on this blog since 2005. I’m sharing a few below. I hope you’ll open the links and take a look, then share the ideas through your own blogs, videos, etc.
Here’s
an article where I use maps to show where people need extra help.

It’s one of dozens where I show the four-part, information-based problem-solving strategy that I’ve piloted since forming the Tutor/Mentor Connection in 1993, and Tutor/Mentor Institute, LLC in 2011. It’s one where I point to a section of my library with hundreds of links to articles and research about poverty, racism, inequality and social justice. And, it’s one where I encourage others to share this information in their network, so more people find it and use it.
When I formed the Tutor/Mentor Connection the goal was to help every existing tutor/mentor program in the Chicago region get the operating resources, volunteers and ideas each program needs to grow. Here’s
one of many articles that focus on the challenges of finding on-going funding for mentor-based programs.
My leadership of a single volunteer-based tutor/mentor program from 1975 to 1992 and a second program starting in 1993, along with my career in retail advertising with the Montgomery Ward corporation, provided the foundation ideas for the Tutor/Mentor Connection.
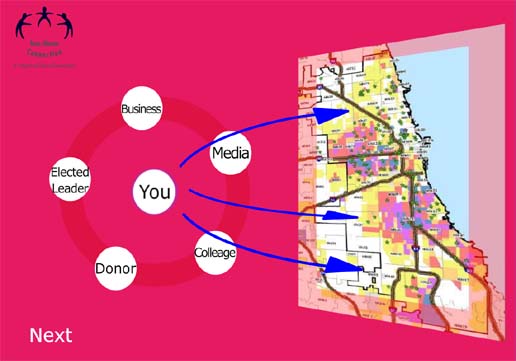
These experiences led me to understand that organized volunteer-based programs were a way to connect kids in high poverty areas to people, experiences and opportunities that were not readily available in their own family/neighborhoods, due to extreme poverty. Over time, I began to understand this as a form of ‘bridging social capital’ and visualized it in graphics like the one shown below.
Here’s
one of many articles where I write about mentoring as a form of social capital.
In my work at Montgomery Ward’s corporate headquarters, from 1973 to 1990, I learned how my department, and other functional teams, supported more than 400 retail stores spread in 40 states. We helped each store be good at attracting customers, selling merchandise and earning a profit. (at least we tried)
Thus, when we formed the Tutor/Mentor Connection plan in 1993 our initial strategy was to learn what programs existed in Chicago, then to build a public awareness strategy that would attract more attention, volunteers and donors to each program, and to every high poverty neighborhood. This article shows how we began publishing a Directory of programs in 1994 and how this information was used to support programs.
In
this article I describe an on-going information-based planning process, that uses information like I’ve been collecting.
This could be led from institutions who have deep roots in geographic areas, like hospitals, universities, businesses, etc.
To do this research, someone needs to host
a library like mine, with lists and directories of youth serving programs, then use that information in an on-going planning, program development and public education and resource generation strategy.
This is a missing step in most of the research I’ve seen for over 25 years. Researchers get the money to do the research and produce a report, with a big event that shares it with the public, but then don't have the money to continue to share that research and draw people together to use it over the following years. What I do is aggregate links to that research and try to motivate people to use it to support youth tutor/mentor and learning programs in every high poverty area of cities like Chicago.
I encourage you to look at articles,
like this, where I point to work being done by Daniel Max Crowley, who I met on LinkedIn. He calls on universities to go beyond collecting research to helping communities use it.
Over the past 30 years I've piloted actions that I share on my website and that anyone can borrow and apply in their own geographic area.While I do find a few who host lists of youth serving programs, and even plot the list on interactive maps, I don’t find any with multi-year public awareness efforts aimed at drawing volunteers and donors to every youth-serving program within their city.
If you know of any who do this, please share the link and I'll add them to my library.
Furthermore, I don’t find any doing the deeper research asking “what youth programs exist in your area”.
Doing such research and maintaining a list of programs is a big job, especially in cities as large as Chicago. That’s why, for many years, I’ve tried to motivate universities to build a Tutor/Mentor Connection-based strategy on their campus.
This is one of several articles where I share this invitation.
Here’s
an article where I show
30 years of effort to build strategic alliances with universities. You can see a wide range of interactions with many universities, but no long-term initiative led by, and funded by, any university.
Why wasn’t I successful? Money. Reputation. Clout.
I never had much of any of these so when I met with someone at a university, I’d receive polite nods, with a “I’m already over extended. Find a younger professor.”
The answer: ultra wealthy donors
Here's
one of several articles where I show the potential of strategic investment by one or more wealthy donors. Here's
another.
How might we find such donors? They are all around us. Do you watch NFL football games? How often do you hear players praised for their philanthropic work? I posted this on Twitter in 2024 sharing the idea from
this post.
What if a university aggregated this information and then used it to recruit a group of athletes who support the same cause, to support a Tutor/Mentor Connection strategy at the university that was building the database of athlete involvement?
What if? What if? What if? What if you share this article in your networks? Maybe someone will read it and adopt the idea and actually take the next steps.
That’s why I write these articles.
If you're connected to a university, or looking to put your name on a building at your alma mater, I hope you'll make this your mission.
Thanks for reading. There's a lot here, so bookmark the page and return often. Then, look me up on LinkedIn, BlueSky, Instagram, Facebook, Twitter, etc. and let's connect. If you're writing similar articles, which I hope you will, please share them.
Finally, if you're able, please
visit this page and make a contribution to help fund my work.