Showing posts with label maps-a. Show all posts

Tuesday, July 07, 2026

What's Needed in an on-line Tutor/Mentor Program Locator?

This week I posted a new article on Substack.com that shows how I've been using GIG maps since 1993. I hope you'll read it. click here


I pointed to articles on the MappingforJustice blog, such as this one, that show examples of how I've used maps, and how others are doing similar work. 

And, I encouraged universities, and others, to borrow from my history  and build their own platform to support youth-serving programs in their community, and to help them reach more K-12 kids in every high poverty area.  

So what is involved.  Take a look at this concept map.

From left to right I show

a) boundary layers - city, zip code, community area, state and federal legislative districts, etc.

b) indicators layers - poverty, violence, poorly performing schools, etc.

c) programs - while I focus on tutor/mentor programs, this could also show arts/science, or other types of services which need to be located close to consumers, meaning many are needed throughout the city.  The programs layer can be sorted by age group served, type of program, time of day

sample map
d) this shows the goal of the program locator, and the Tutor/Mentor Connection/ Institute, LLC.  We want to help leaders use this to build support for existing programs and help new ones form where needed.  At the right is an example of a map view that can be created using the program locator, then adding additional annotation using Power Point

e) assets layers - in this section you can find sub sections for banks,  hospitals, universities, faith groups, drug stores, and insurance companies, with offices/branches in different locations throughout the city. 

sample map
Using this information a map of a small section of the city can be created that shows indicators of need, existing programs and assets who share the geography, and thus should be expected to support programs that help kids in that area.

Ideally an updated version of the Program Locator would find ways to pull data on assets from resource files on the Internet, making this a continually updated feature.

Two features were never built into the program locator.

a) I wanted to be able to connect data from indicators into a form that program leaders (or donors) could use to determine the need for tutor/mentor programs in specific neighborhoods.  Imagine clicking on a community area and getting a form showing number of kids; level of poverty, locations of existing programs, age group, type of program, etc. A program would just fill in their program information on the form and get a printed document to send to a donor.  View this PDF to see how a map might show the number of kids in a community area. 

b) I wanted to create another layer that could be used to raise money for programs shown on the map, and to track donations to do an analysis showing the different levels of funding going to different neighborhoods.  I describe what I have in mind on this page of my planning wiki.

In another concept map I've been sharing links to platforms that collect and map data, shown all the places in the country where people need extra help.


Most of these show where help is needed, but don't host a directory of organizations who are trying to solve those problems.  And, if a service needs to be close in order for people to participate, many such organizations would be needed in big cities like Chicago.

And they all compete with each other for scarce funding.

If you live in one of the cities where there are pockets of concentrated poverty and your newspaper headlines are showing "bad news" happening,  why not reach out to technologists in your community or at your local university.  Show them how I've been using maps and the Program Locator that was built in 2008. 

Encourage them to build a similar resource for your community.

If you'd like my help, just reach out on LinkedIn.

That's just one place where you can find me. Visit this page to see my social media links.

And, if you want to help me pay the bills, visit this page. 

Friday, March 22, 2024

Using maps to draw attention and resources to high poverty areas

This week I watched two panel discussions hosted by Friends of the Children - Chicago.  One is shown below. You can find the second at this link.


Friends of the Children has a long-term model of supporting kids from first grade through high school.  In these videos the speakers make a case for why volunteer-based tutor/mentor programs are needed in areas with many indicators of need, such as high poverty, violence, poorly performing schools, etc. 

I've used graphics like the one below to emphasize the need for long-term programs in high poverty areas of Chicago, so I'd like to see more programs who build such support for kids into their core strategies.  


What I did not see in the videos was anyone holding up a map of Chicago, saying "We need programs like this in every high poverty neighborhood, not just a few."

I've been using maps since 1994 to show where tutor/mentor programs are most needed, and where existing programs were already operating. I've also used them as part of a "Rest of the Story" public awareness strategy.  Below is an example.


This map-story was created in 1996 following a feature story in the Chicago SunTimes with a headline of "Slain children mourned: 'When will this end?"  My strategy was to leverage the public attention of the news report to show the areas where the shooting took place, and to show any tutor/mentor programs in the area (if there were any).  In creating these maps, we also showed "assets", businesses, faith groups, hospitals, universities, etc, who shared the area, and who should be strategic in helping tutor/mentor programs grow near where they do business.  

Unfortunately, we did not have the Internet available in the 1990s so few people actually saw these map stories.  I've been sharing them on this blog and the MappingforJustice blog since 2008. 

Over the past two weeks I've posted several articles showing some of my archives.  Now you can look at two more sections.

This folder includes more than 90 map stories created since the 1990s. 


This folder is even larger.  It contains more than 600 maps and images, mostly created since 2008, which I've used in blog articles, strategy presentations and newsletters.  


Not all of the images in this folder were created by myself, or the volunteers and paid part-time staff, who created maps for me.  Some are screenshots from other websites that we used in stories on one of our blogs.  Some are images of work done in 2008-10 to build the Chicago Tutor/Mentor Program Locator Directory (which has been an archive since 2018). 


By sharing these archives I hope to serve as a resource for students and learners throughout the USA and the world, to demonstrate strategies for helping draw attention to places where the people and the planet need extra help, and extra, on-going, long-term, resources.

Between 2006 and 2015 interns from various universities in Chicago and South Korea spent time looking at articles on my blog and website, then created their own visualizations sharing what they were learning with people they know.  You can see their work on this page

My goal is to inspire a donor to make a major gift to a university that would fund a Tutor/Mentor Connection study program, where students do similar research and build a similar library of media stories and maps.

Imagine finding an archive like mine on a university website 10 to 15 years from now.

The graphic below visualizes my goal. Universities could be creating future social problem solving leaders who are constantly learning from each other and constantly feeding their own experiences into central depositories of wisdom.  


This blog article describes this as a "Tipping Point", because it not only grows a new cadre of leaders who use AI and other tools to aggregate information and draw from these libraries to support their own work, but also educates alumni who go into business and professions, rather than social service, to be proactive, on-going, and generous in supporting those who do go into social service work.

Since the 1990s, I've been building a library of information to support what people do to help kids in high poverty areas connect with adult tutors, mentors, learning opportunities and jobs.  The concept map below shows that library.


The challenge with such a growing amount of information is motivating people to spend time looking at it, and using it to support what they do to help themselves and their family, and to help others create a better future for all of us.


Thanks for reading. And thanks for sharing.

I'm on Twitter (X), Facebook, LinkedIn, Instagram and a few other platforms (see links here). I hope you'll connect with me.


If you'd like to help me pay the bills, please visit this page and make a contribution.  

I'm not a 501-c-3 nonprofit, so cannot offer you a tax deduction, but can promise to use your contribution to keep this library of ideas freely available to you and the world.


Wednesday, February 28, 2024

Opportunity for All? Involvement of More.

Last week I posted some maps created from an interactive dashboard built by the Economic Innovation Group (EIG) that enable you to zoom into different places in America to see, at the census tract level, where poverty persists.  

Today they released another dashboard, showing where economic prosperity is more prevalent, and where distressed communities are located.   The poverty rate is part of this index, but other factors are also included. Read about the DCI on this page

Below is one view of that dashboard.

Here is a second view, this time centering on the Chicago region, where I've worked for the past 30 years to help volunteer-based tutor, mentor and learning programs grow.

This map shows that there are many places in the Chicago region and Northwest Indiana that have distressed communities. So do other cities surrounding Lake Michigan, such as Milwaukee and Kenosha, Wisconsin, Waukegan, Illinois, Benton Harbor and cities further East.

To help you understand the data shown on this map, read some of the stories shared on the platform.  This one, titled "Economic inequality often divides neighboring communities", is especially relevant. It shows how communities, like the Dallas-Ft. Worth area, have a huge variation in economic well-being.  If you zoom into the Chicago region, or other big cities, you'll see the same pattern.

Since I began serving as a volunteer tutor/mentor in 1973 I've been building a library of articles to help me understand why tutor/mentor programs were needed and where. Over the past 25 years I've accelerated that information collection, building a wide range of articles about race, poverty, inequality and social justice.  

I use this concept map to point to the various sections of my library where I share these links.

When we formed the Tutor/Mentor Connection (T/MC) in 1993 our mission was   

"to gather and organize all that is known about successful non-school tutoring/mentoring programs and apply that knowledge to expand the availability and enhance the effectiveness of these services to children throughout the Chicago region."

 On the mission page of my website I show that

THIS IS A MARKETING PLAN INTENDED TO MAKE HIGH QUALITY, CONSTANTLY IMPROVING NON-SCHOOL TUTOR/MENTOR PROGRAMS AVAILABLE TO THOUSANDS OF YOUTH LIVING IN HIGH POVERTY NEIGHBORHOODS OF THE US AND THE WORLD

On the strategy page I show this concept map, outlining four concurrent strategies. 


I created this graphic many years ago to show the intermediary role the Tutor/Mentor Connection has taken since 1993 and that I've tried to continue via the Tutor/Mentor Institute, LLC since 2011.


The information I share can be used by anyone in any part of the country to help people living in distressed communities move toward economic prosperity. It can be used to understand our long history of racism and inequality and current threats to democracy and freedom.  It can be used to draw people from all sectors into conversations and learning that leads to problem solving and solutions.

Using the EIG map anyone can create a different version of my graphic, replacing the Chicago region with their own part of the country.  Anyone can build a library showing local issues and link to my library showing a broader range of information (and in my library I point to many websites which themselves are extensive libraries).

So why aren't more people involved solving these problems?  Maybe one reason is that too many people don't want them to be solved, for their own self interests or political/religious beliefs.

I'm sure a major reason is that there are so many other competing issues, and most people struggle with their own personal well-being and that of their own families.


Maybe another is that most people don't live in distressed areas. These are not their problems, or their daily lived experience.  The map views below illustrate this point.

This is a view of the EIG dashboard showing persistent poverty by census tract.

If you look at the map from this view, you can hardly see the persistent poverty areas around Lake Michigan or in Ohio.  You need to zoom in to see high poverty areas around Lake Michigan.


However, these are small islands in an ocean of opportunity.  Unless you live near, or in, one of the shaded areas on the map, this is not your lived experience. You only understand the problem from what you read in the news, or on social media, which is often a very biased point-of-view.

3-7-2024 update - Here's an article using the EIG dashboard to show patterns of neighborhood distress in US metros

The reason I support volunteer-based tutor/mentor programs is that they not only can offer life-changing opportunities for kids lucky enough to participate in an organized program, but they draw people from beyond poverty into a shared experience with kids and families who do live in these areas.

I created this concept map to show how volunteers who are well-supported, and stay involved for multiple years, begin to learn more about the challenges facing youth and families, and in some cases, become willing to do more to try to help remove those challenges. 

I did not have the library of information that I now host 49 years ago when I began leading a tutor/mentor program.  In fact, I did not begin to intentionally collect race-poverty information until the mid 1990s.  Initially, I focused on the benefits of being part of a tutor/mentor program as "diversity training".  

Here's an article from page 2 of my January-February 1997 T/MC Report newsletter report that shows how "One-on-one tutor/mentor programs offer the best diversity training program any company might invest in." (It's always embarrassing to find typos in past articles that I wrote. Ugh.)


As we built the Tutor/Mentor library in the 1990s and 2000s we began sharing the information with our students and volunteers, encouraging them to use the learning resources to help students succeed in school and to help volunteers understand the history of slavery and racism and the continued challenges faced by people who live in areas of concentrated poverty, which are the areas highlighted on the EIG dashboards.

I've been singing this song for a long time as the 1997 T/MC Report newsletter shows.  Here's a more recent article, posted in 2015.  It includes the graphic shown below.


I highlighted the part that reads "We can give ourselves a cozy feeling of cheaply acquired nobility by apologizing for past injustices. Or we can stop patting ourselves on the back and cross the tracks to the other side of town to take small, concrete, unglamorous steps to end present-day suffering."

This was written in 1997 following the President's Summit for America's Future, hosted by President Clinton and every other living President, to focus on improving the lives of the 14 million youth living in poverty in America.

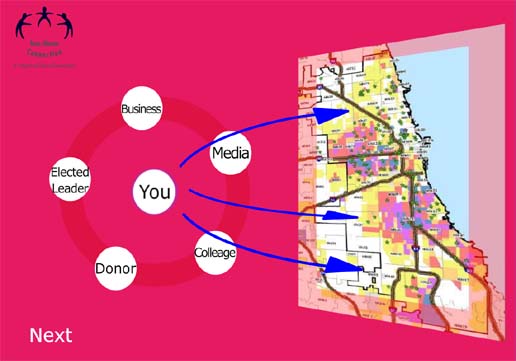
One last graphic.  Take the YOU role and share this information.  Do what I've been doing.


I've written this blog since 2005.  I've shared this information on websites since around 1998.  I shared via print newsletters from 1993 to 2003 and email newsletters from the early 2000s till today. I've posted regularly on social media.  

All to motivate more people to "cross the tracks" and "take small, concrete steps" that would help kids living in areas of concentrated, persistent poverty have mentor-rich pathways from birth-to-work.

If thousands of people in Chicago and other cities had shared this information as often over the past 25 years, and with their own creativity, perhaps there would be fewer areas of distressed communities and/or persistent poverty.  Maybe we would be closer to solving some of the other problems buried in our history as a nation.


Thanks for reading. Thanks for sharing.  Please spend time reading other articles on this blog.  Help me find leaders who will carry this work forward in future years. 

Find me on Twitter (X), LinkedIn, Facebook, Instagram, Mastodon and other platforms (see links here).

I don't have a salary for doing this work (since 2011). So if you want to help, visit this page and make a small contribution.


Friday, September 08, 2023

How Many Tutor/Mentor Programs are Needed in Chicago?

 In 1994 when we were launching the Tutor/Mentor Connection in Chicago, this Chicago Tribune front page showed 240,000 kids "at risk" because they were in "poverty's grip". 


The map in the Tribune article showed high poverty levels on the West and South sides of Chicago.  

This information has fueled my efforts to help volunteer-based tutor/mentor programs grow in these areas for the past 30 years.  I've continued to look for data and maps that showed this information at the neighborhood level and showed the number of kids enrolled in volunteer-based tutor/mentor programs.

The only time I was able to get close to this information was in 1997 when the Associated Colleges of Illinois used our data to determine how many kids were enrolled in exiting programs.

The map below was included in the report. The survey of 300 organizations showed that "fewer than 6% of Chicago's school-age population is reached by these tutor/mentor organizations". 


I included this map in a 1999 article I addressed to billionaires. Here's a link to a 2016 article that also includes the map.  Here's the link to the 1997 report

In 2011 I was able to get data from the Heartland Alliance that I used to show the number of kids, age 6 to 17, in each Chicago Community Area.  I was able to update that in 2018, and you can view that report below.


I wish there had been a program at a Chicago university that had been working with me and doing this research for the past 30 years, and using the data to guide public and private investment in high poverty areas.  There's been a ton of research, but none focused on increasing support for tutor/mentor programs or helping more grow where the data shows a need. 

So where are we in 2023?  Today I saw a post on Twitter that pointed me to an article by Chalkbeat Chicago.


This article shows that there has been a steady decline of low-income kids in many Chicago neighborhoods and that the percent of low income kids has declined significantly in some schools as more affluent families move into those neighborhoods. 

This article is full of percents, with no raw numbers or maps. So I did a search to determine how many students are currently enrolled in Chicago Public Schools.


I found this "Stats and Facts" page hosted by Chicago Public schools.  It shows 322, 106 students enrolled at the start of the 2022-23 school year, in 634 schools.  It also shows that 72.7 % are economically disadvantaged. 

I multiplied the total number of elementary school kids by 72.7% and show 132,772 low income kids. I multiplied the number of high school kids by the same percent and show 74,248 kids.  That totals 207,020 low income kids attending Chicago Public Schools.

This is significantly lower than the 240,000 number in the 1994 Chicago Tribune article, but it's still a huge number of kids who might benefit from well organized, non-school, volunteer-based tutor, mentor and learning programs.

Over the past 10 years I've posted several articles inviting researchers to do market-research to provide information showing how many kids in different areas might benefit from tutor/mentor programs, and how many kids in those same areas were currently part of existing programs.

In one article I included maps like the one below.


In another article I included these two graphics


In another article I included this map of the United States, showing cities with high concentrations of poverty.


Each of these cities should have a research intermediary that borrows strategies piloted since 1993 by the Tutor/Mentor Connection, who collects and reports information that everyone else in that city can use to supply the resources needed to reach a higher percent of kids in high poverty areas with well-organized, mentor-rich, non-school tutor, mentor and learning programs. 

Researchers in Chicago could use my lists of tutor, mentor and learning programs as a starting point in collecting data about "how many are served" and "in what locations". 


I've been sharing this message for nearly 30 years but far too few people have ever seen it, or have dug deep enough into the work I was doing to understand it, support it, and/or duplicate it in other cities.

Today's media reports just are another reminder that without a comprehensive system of support that provides excellent learning and teaching during the school-day hours, well organized enrichment in the after-school hours, and mentor-rich programs in the after 5pm, weekend and Internet hours, we'll reach too few kids with the long-term support many need.

Below is a graphic that I've shared often in my articles.


Be the YOU in this graphic. Share my articles with people in your own network.  Start a conversation. Get more people involved.  If you're part of a university, or a billionaire giving away a fortune, look for ways to embed the Tutor/Mentor Connection strategy on a college campus.

Do it while I'm still alive to offer my help.

Thanks for reading. 

My social media links are on this page.   My FundT/MI page is here.  Help me if you can.

12/1/2023 update - Visit this section of the Tutor/Mentor library and find several dozen data platforms that you can use to understand where people need extra help. 

12/1/2023 update - view this concept map to see data platforms that you can use.


Friday, July 29, 2022

30 Year History of Mapping

On this blog and the MappingforJustice blog you will see numerous articles showing the use of maps.  In some articles, like this, I've tried to show what our vision was and how far we got in achieving that vision. 

About a  month ago I decided to try to create a concept map to visualize this journey. It's shown below. You can view it at this link


Since this map has so much information I'm using this article to walk you through it, starting from the top row, far left, and moving to the far right, then, starting again on the second row, far left. Follow the links  under each node to learn more.  Let's go!

I became a volunteer tutor in 1973 while starting a retail advertising career at the Montgomery Ward headquarters in Chicago. I began leading the volunteer program in 1975.  Much of what I learned over the next 17 years led to forming the Tutor/Mentor Connection in late 1992 as we were forming a new teen program that we called Cabrini Connections.  We spent all of 1993 planning the T/MC 10-point strategy, then launched in January 1994, with our first Tutor/Mentor Programs Survey.

120 programs responded to the first survey and more than half said they wanted more contact with peers. More than 70% said they'd come to a conference if it were free, or low cost.  So we organized the first Tutor/Mentor Conference in May 1994 and at the same time, published our list of programs in a printed Directory.  


Response was so positive that we held a second conference and published an updated Directory in November 1994. We held conferences every six months after that, until May 2015. We published an annual printed directory until 2003.

Since we had a list of Chicago tutor/mentor programs we were not only able to organize conferences, we were also able to organize an annual August/September Chicagoland Tutor/Mentor Volunteer Recruitment Campaign. This grew every year through 2003 when we began to focus primarily on the Internet as a way to recruit volunteers for programs throughout the region.


We began to try to build a website around 1997, hosted by a Chicago area company.  Then in 1998 one of our Cabrini Connections volunteers built the first tutormentorconnection.org website (now an archive), using the hub/spoke graphic on the home page to show information available on the site and our vision for bringing people from different sectors together. 

The tutormentorexchange.net site was built in 1999 by Steve Roussos, a PhD student from the University of Kansas. This was built as an emergency replacement to host our list of tutor/mentor programs when the T/MC site suddenly went off line, right before the annual recruitment campaign. 

I started putting PDF strategy essays on this site around 2000 and it's now the primary site of the Tutor/Mentor Institute, LLC. 

We continued to do the annual program survey each year and update our database of programs, but this was very time consuming. In 2004 an intern from India created an on-line platform that programs could use to update their own information and that made it easier for us to also keep information updated.

The public facing version of the 2004 program locator was a searchable directory, which is described in this PDF.   Then, in 2008 a team from India created a new version of the Program Locator, which is shown at the left.

The new version was revolutionary. 

In our 2004 Program Locator, you could find available programs by searching a zip code, and by entering conditions, such as type of program and age group served. This worked like Google, meaning if you knew something about what you were looking for, you could find it.

The 2008 version started with the question of "where are programs most needed?" then "what programs are available in those places?"  It started with a map of the entire Chicago region.  Thus, it was a better tool for leaders to use to assure that well-organized programs were available in all high poverty areas, not just a few. Leaders could look at the whole city, or just a few neighborhoods. 

Unfortunately, just as we were building the interactive platform in 2008 the US and world economy began to enter a recession that lasted for the next 3 years. This affected many of our donors and we lost funding.  Ultimately this led the board of Directors to discontinue the Tutor/Mentor Connection part of the organization.  I was asked to "retire" at this time, but was given full ownership of the T/MC. I created the Tutor/Mentor Institute, LLC in 2011 to try to keep the T/MC available to Chicago and help it expand to other cities.  

I have not been successful at building a new organization or a new funding base so over the past 10 years the mapping websites have ceased to work and we're no longer hosting a conference. I do still maintain the web library and list of programs, which are now plotted on a platform hosted by map-a-list.com.  And I use this blog, an email newsletter and active networking on social media to encourage the networking and idea sharing that were features of the Tutor/Mentor Conferences.  I reach far more people than ever before. 

So, what were we trying to accomplish with the maps?


From 1993 on our goal was to make maps that leaders would use to build on-going support for youth tutor/mentor programs in different high poverty areas of Chicago.  While we received donated GIS software from ESRI in 1994, we never had money to hire more than a few hours of part time help to make maps using this software.   

I remember sitting in a meeting in 1993 or early 1994 where a company was using an interactive GIS platform to show where work needed to be done in Chicago. That was always my goal for using GIS maps.  In early 2022 I met a company called RS21 who is demonstrating this capability through videos such as this one. 

While we did not reach this ability to do interactive presentations, we did make a lot of maps.


Since we had almost no money for advertising, but did have pro-bono help from a public relations company from (1993 to 2002), we developed a "Rest of the Story" strategy to build maps that showed areas featured in Chicago Tribune and SunTimes stories about violence, gangs, poverty and poorly performing schools.  Our maps showed location of any tutor/mentor programs in the map area, and showed assets (business, colleges, hospitals, faith groups, etc) who were in the same area and who could be helping programs grow. 


In late 2007 we received an anonymous donation of $50,000 to rebuild our mapping capacity.  We used half of this to hire Mike Trakin, a GIS map maker, on a part time basis. Mike started the MappingforJustice blog in 2008 to show the maps he was making. He also build a map gallery (now an archive).  Mike stayed on staff until early 2011 when funding ran out.  

As shown above we also used the funds from the anonymous donation to build the interactive Tutor/Mentor Program Locator.  That has been used to create many of the map stories shown on our blogs since 2008.

What's the future? 

The last section of the concept map at the far right shows that I continue to share our overall mapping goals on this page of the Tutor/Mentor Institute, LLC website. 


However, rather than seek investment to rebuild the Tutor/Mentor Connection under my leadership, my goal is to motivate donors to provide funding at universities in Chicago and other places, to build Tutor/Mentor Connection strategies, with mapping, on their campuses.  

While I plan to continue to advocate and share strategies for helping tutor/mentor programs grow for the rest of my life, I'm now 75 and don't know how many years I have left.

Funding a Tutor/Mentor Connection on a college campus can unleash a flow of talent that comes to the campus, learns what the Tutor/Mentor Connection is (from our archives); how to lead a individual tutor/mentor program and/or a neighborhood or citywide strategy aimed at filling a geographic area with a full range of needed programs that do more to help kids move through school and into jobs and career; then goes into alumni life either working in the social sector applying these ideas, or working in the business sector, generating funds and resources to support the growth of constantly improving programs in all places where they are needed.

3-26-2024 update - in this blog article I share links to my Google archive showing maps created over the past 30 years. 


Thank for reading this far.  Open the concept map now and view it with these descriptions in mind. Follow the links to dig deeper.   If you're interested in knowing more please connect with me on Twitter, Instagram, LinkedIn and/or Facebook (see links  here).  

If you want to help me keep paying the bills, use the PayPal on this page to send a contribution.