Below is a map showing cities in the USA with neighborhoods of concentrated poverty. It's from a new BrookingsMetro report. I point to it in this article on the MappingforJustice blog.

Another graphic in the article focuses on 12 cities, including Chicago, showing areas of high poverty.

I started using maps in 1993 when forming the Tutor/Mentor Connection. With a map a leader can focus attention and resources on every high poverty area within a geographic region. Without the map a leader can point to a long list of organizations he supports, but still miss most neighborhoods where people need extra help.
The only difference is that there are fewer kids in some of these Chicago neighborhoods now than in 1993 due to thousands of families leaving the city.
Here's one report showing CPS enrollment decline from 431,750 in 1999-2000 to 330,411 in 2021-22.
That means there still are a lot of kids who could benefit from extra support provided by an organized tutor, mentor and learning program.
Since 1975 I've been building a library of articles and research showing where poverty is concentrated and why tutor/mentor programs and other forms of support are needed. When we formed the Tutor/Mentor Connection in 1993 we dramatically expanded the library and launched efforts to share that with others in Chicago. When we launched our first website in 1998 we began collecting and sharing information with people throughout the USA and the world.
I use concept maps to show information in the library. The one below shows sections with poverty maps and with articles about race, poverty and inequality. The 2022 BrookingsMetro report is just one more addition to this list.

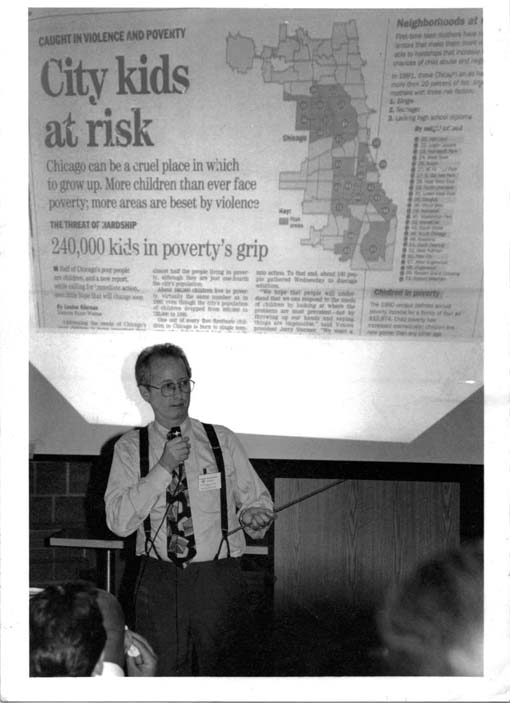
In this April 2015 article I showed a Chicago SunTimes article from 1993, which bemoans the fact that so little was done in the previous 20 years to reduce poverty in Chicago.

Today's article is just one more reminder that anyone reading this can be the YOU in the graphic below, sharing this article and the research with people you know, who will then share it with others.

All of the articles I've posted since 2005 in this blog and since 1993 in printed newsletters are templates anyone can use to create their own communications and network building campaigns.
If you want the maps of Chicago or other cities to look different in 2040 you need to start doing what's needed now.
Thanks for reading. Please connect and follow me on Twitter, Facebook, LinkedIn and Instagram (see links here).
If you'd like to help Fund the Tutor/Mentor Institute, LLC, click here. Your help would be greatly appreciated.


No comments:
Post a Comment