Showing posts sorted by relevance for query planning needed. Sort by date Show all posts

Thursday, September 05, 2024

Mapping Birth-to-Work Strategies

 I've used visualizations like the one below for more than 20 years to show the need for long-term, birth-to-work strategies, that reach K-12 youth in every high poverty area of Chicago and other places with concentrations of persistent poverty.

I included this graphic in this July 2018 article titled "After the march, do the planning".   It's one of more than 200 articles posted on this blog that focus on "violence" prevention and "planning".  My goal is that youth and adults from around the USA are are reading these articles and sharing their interpretations with friends, family and co-workers to help mentor-rich birth-to-work programs grow in every high poverty area of Chicago and other parts of the country.

You can look at the graphic above in several ways.

1) It includes a map, showing high poverty areas of Chicago. Programs that help kids through school and into adult lives need to be in every one of these zip codes.

2) The horizontal arrow shows the "birth-to-work" timeline, which takes 20-25 years for EVERY youth. Those in high poverty areas don't have the same range of natural support that kids in more affluent areas have, so those supports need to be made available through school and no-school hours programming.  I wrote this article focusing on some of the needed programming. 

3) You can also think of the graphic as a guide to investments needed.  Since the arrow, and the graphic above, shows stages kids grow through as they move from "birth-to-work", communities need to innovate ways to drive needed operating dollars, technology, talent and ideas into every high poverty neighborhood, making age appropriate programs available at each stage on the timeline.  Furthermore, at the right end of the arrow these supports need to be job training, interviews and JOBS!

M
aps need to be use for multiple purposes. They can show demographic and poverty data as layers of information, pointing to places where people need extra help. 

They can show access routes through neighborhoods which might help volunteers see more places where they can connect with youth in organized programs.

They can show locations of programs, and potential support, such as banks, colleges, hospitals, faith groups, etc. We created a Chicago tutor/mentor Program Locator in 2004 and updated it in 2008 to enable people to create a map view showing small sections of the city, that could be used in planning.  It's now an archive due to lack of continued funding. 

Maps can also show who's involved, as these Tutor/Mentor Leadership and Networking Conference maps demonstrate.  

Most importantly, maps can show a distribution of dollars and involvement.  Foundations,  companies and government programs have the ability to create maps that show where their dollars are landing, and/or where company volunteers are involved as board members, or volunteers serving as tutors, mentors, tech support or marketing and fund raising support.  

But there are also other types of maps that planners should be using.  View the concept map shown in the graphic below at this link.  It shows supports needed at each grade level, in EVERY high poverty area of Chicago and other places.


Here's another concept map to look at.  It shows challenges facing people in high poverty areas. While building great school and non-school programs is needed, removing the barriers enables these schools to have greater success.


Now, take a look at maps created with systems mapping tools like KUMU.
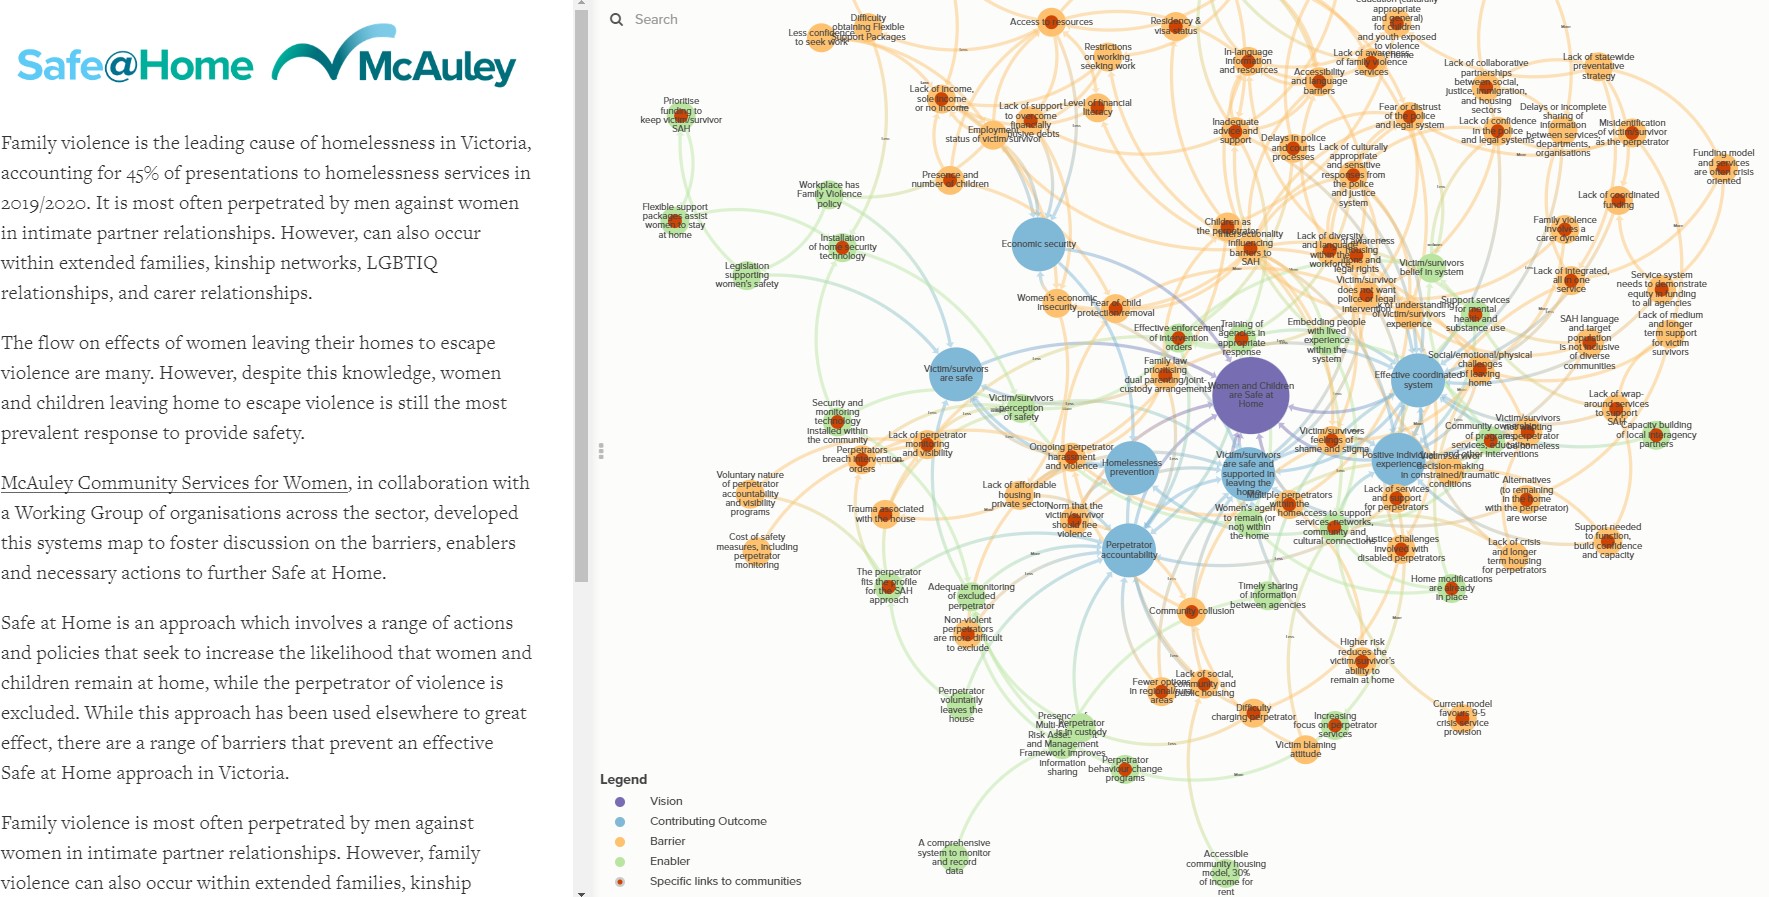

I've posted several articles showing how planners can use tools like KUMU.  On LinkedIn I found this post, by KUMU, showing a planning process focused on family violence in Victoria, Canada.  Open the project map at this link.   

Look at other examples that I've posted in these articles, including one showing how Senator Elizabeth Warren used a KUMU map in her 2016 Presidential campaign to show her strategy for empowering American workers and raising wages.    

Using GIS maps to show where help is needed and systems maps to help understand a problem and potential solutions, and guide resources to places where help is needed, can lead to new and better implementation of solutions.

So far I can find too few examples of maps being used this way, thus, there is little accountability assuring that funds and resources support all stages of the "birth-to-work" timeline, in every zip code where such programs are needed.

I no longer have the organizational capacity to update the program locator and implement these ideas. Instead, I want to be part of planning teams who read these articles and are trying to innovate ways to implement them in different locations.

In this article I show my 30 year history of reaching out to universities, and my continued goal that one, or many, universities begin doing the work that I describe in this and other blog articles.


As places with a brick-and-mortar investment in communities and a pipeline of students coming from high school to college, then on into adult lives and careers, universities are uniquely able to adopt long-term planning, if donors will provide long-term funding!

If you're doing this work, please use my resources and archives and invite me to help you make sense of it all!

I'm on these social media channels. If you're interested in knowing more and starting a conversation, just reach out to me.

If you want to help fund the work I'm doing, just go to this page and use PayPal to send your support. 

Thank you for reading.

Saturday, February 04, 2012

Battle Plan for War on Poverty

I attended a STEM Education Summit in the Chicago area on Friday, hosted at Oak Park/River Forest High School. While the speakers at this Summit were not talking about the high school drop out crisis, which I've written about in past articles, they were talking about a workforce crisis that will result from baby-boomers retiring and not enough young people preparing to go into STEM (Science, Technology, Engineering and Math) related careers.

Over the past 18 years I've created a variety of graphics to illustrate this problem. The one below shows that the "pipeline to careers" is not working well enough to reach kids at an early age and provide a wide range of mentoring and learning supports that would result in a larger number finishing high school and post high school education and entering careers in STEM or any other avocation they choose.


In the conferences I go to and web sites I browse I don't see many who are using maps and charts and thinking about this problem the way generals and CEOs think about the distribution channels and logistics needed to win military wars, or business wars.

A few years ago I created a graphic that illustrates the planning that would need to take place to enable more and better mentor-rich programs to be in neighborhoods where kids don't have an effective entry point into the "pipeline to careers" nor to that have enough effective supports along the way. As a result, we're losing kids to street violence, bad health, poor nutrition, and lack of preparation for adult jobs and responsibilities.

I've been trying to think of a way to communicate this idea in an article that I could post on the Tutor/Mentor Institute, LLC web site or in the collection I've been building on Scribd.com.

If you look at this chart you'll see how I compare the planning process needed to support military forces in many places to that needed to make tutor/mentor programs available in many places. While many might want to create "pilots" or "demonstration projects" we can't really afford not to have some sort of learning support reaching K-12 kids in all of the high poverty areas of Chicago with intense forms of learning support and mentoring, while also providing needed supports to kids in all other neighborhoods who may need more inspiration and support to succeed in school and/or choose STEM careers.

Maps can help us focus our attention on specific parts of a problem. Out of all the people talking about education reform, perhaps some can focus just on high poverty neighborhoods, while others can focus on non-poverty areas. If we can segment our focus then we're talking about the same problems and able to converge on better solutions than if we have a mixed bag of discussion where the words are the same but the meanings are different, depending on what the economic and community support is for the kids you're talking about.

So, if we have a team focused on helping kids born in poverty be starting STEM careers in 20-25 years, the first step is to be building a library of information and ideas that the group can use to innovate new solutions that might generate more consistent support, and a better distribution of resources in more places.

To reach youth at every age level in more places with age-appropriate mentoring and learning a huge range of programs will be needed, meaning the planners need to be thinking of ways to recruit, train and equip thousands of program organizers, leaders, tutors, mentors, coaches, etc.

Imagine the logistics needed to put military forces all over the world and keep them supplied with food, weapons, ammunition, medicine, etc. The army of teachers, tutors, mentors and leaders needed to reach kids in every poverty neighborhood of the Chicago region requires the same type of on-going support.

The War in Iraq lasted over 8 years. World War II lasted 4 years. WalMart has been growing for more than 40 years! Imagine the thinking that is being done some place in the headquarters of the military and at companies like Wal Mart that enables them to constantly recruit and train new talent to take the place of those who retire, resign or are lost in combat. We need this same type of thinking preparing young people for STEM careers, and for careers leading programs that prepare young people for these careers!

We've spent billions of dollars fighting wars. Big business spends billions of dollars on their human resource development so they have well-trained people in the jobs that need to be filled in order for the companies to be successful. We need people who are innovating ways to generate revenue to support this massive infrastructure of youth development, mentoring and tutoring programs in just the same way.

It all comes down to how well you can build and sustain public attention, interest and support for the war effort. Companies spend millions of dollars on advertising and public relations to maintain support for their business strategies and to attract customers to their products and services. While there are events like National Mentoring Month, National Volunteer Week, Make A Difference Day, Black History Month, etc. where is the coordination and planning needed to turn these into an orchestra of events needed to build long-term public support for this battle plan to end poverty by help more kids through school and into 21st century jobs and careers?

I have been trying to map these ideas using the types of graphics I've used in this article, and using on-line platforms like this Debategraph tool.

I'm not sure how clearly I've communicated this idea. I invite others to do their own version of this story. However, while I may not be communicating as clearly as I'd like, I've spent more years thinking about this from a systems perspective than many others in this country. I've written more than 1000 articles on this blog alone, and created numerous illustrated essays posted on the Tutor/Mentor Institute, LLC site and in many other places.

If you're trying to develop a strategy to mentor kids to jobs and careers, I'd like to encourage you to read some of the articles I've written. I also encourage you to hire me to help you understand these ideas. I can come to you and talk about any of the articles on this blog, or that I've posted in the Tutor/Mentor Institute library or the Scribd.com library.

If you've been fortunate to amass great wealth and you want to leave a legacy, why not put your name on the Tutor/Mentor Institute, LLC or bring the Institute to alma mater where it can be integrated into the work a university does to prepare young people for adult roles.

If you'd like to connect, just post a comment or meet me on Twitter or Facebook.

Saturday, December 07, 2019

Dec. 7, 1941 - A Day to Remember

On December 7, 1941 the US Naval Base at Pearl Harbor was attacked by Japanese planes, which drew the US formally into World War II.

Today we honor the memory of those lost that day, and of those lost and wounded, over the next four years.

Below is a world map showing the positions of Allied (US and friends) and Axis (Germany, Japan and friends) in 1941.  A version of this must have been hanging in the offices of US military leaders.

Blue - Allied countries;  Black - Axis Countries. 1941
The job of planners was to mobilize troops and supplies from the US and Allied countries and place them in direct, and sustained, contact with forces of Axis countries.  When Russia (red area) entered the war on the side of the Allies, the supply chain needed to extend to that portion of the map, too.  That was a huge undertaking, but succeeded over the course of the war.  

Many books, movies and articles have been written that describe how the US turned its economic might from domestic production to military production and mobilized its millions of citizens.  Can this scale of mobilization ever be repeated?

view graphic here
Such a mobilization is now being attempted, led by the United Nations.  

At the right I've combined two graphics. The top is a race-poverty cmap that I created to show challenges youth and families in high poverty areas of the US face.  Under that is the graphic showing the  UN's 17 Global Sustainable Development Goals. You can see both in this article. 

If you've read many articles on this blog you see my frequent use of maps to focus attention on places where people need help, as a result of violence, poverty, poorly performing schools, or a combination of all of these and other indicators.

If you visit the SDGs website you can find maps like the one I've posted below, which is one of several showing world poverty issues, Goal #1, around the world.  

View this SDGs map here

There are 17 Sustainable Development Goals and maps like the one above are available for each. 

Thus, as you think of Pearl Harbor, and how the US and Allies mobilized resources to fight battles in all parts of the world, give some time to thinking of how you might help in the mobilization needed to achieve the SDG goals.  

Here's one more graphic. It's a concept map from my collection that shows the planning needed to support such a mobilization.

Planning needed concept map - click here
On the right side of my concept map is a GIS map, showing all the places in the Chicago region where poverty is concentrated and where organized, long-term tutor, mentor and learning programs are needed to help youth move through school and into adult lives.  On the left are graphics that focus on building public will and the need to influence resource providers, volunteers and public leaders, not just the students, parents and leaders of youth programs in poverty areas.  

data maps
This concept map points to many of the mapping platforms that I draw from to create my own map stories. You can use them, too.

This same thinking applies more broadly to the SDGs.  Without building and sustaining the public will, which the US and Allies did during World War II, there will be no distribution of resources to all places where they are needed and no long-term victory.  

My blog articles and web site are a demonstration of what one person and a small group of people can do to try to create public will and influence actions of others.  Everyone who reads this could be creating their own visualizations and blog articles. Or they could simply be sharing mine through their own personal and social media networks.  

Here's a concept map with links to people who already are doing this "sharing". 

On each of my concept maps is a "help me" graphic, inviting people who value the maps or the ideas I share to provide contributions to do this work. Think of these as "war bonds" asking you to invest dollars to fuel this mobilization. 

If you're able, and willing, to help,  Click Here to add your support. 

Click here to help fund Tutor/Mentor Institute, LLC for 2020
Thank you for reading, for sharing this with your network and for your contributions.  Let's honor the memory of Pearl Harbor with the work we do to create a better world.


Saturday, July 13, 2024

Build information base to support anti-violence efforts

 I saw an announcement that Chicago business leaders were pledging $100 million to support anti-violence efforts in Chicago.  Gee. When have I heard that before.  


Let's see. Here's a 2013 article talking about a $50 million business commitment.  How'd that go? 

Of course, I've been pointing to this October 1992 Chicago SunTimes article for over 30 years. 

What's not happening? 

First, there's no comprehensive strategy, and nothing has lasted for 10-20 consecutive years.

What should be in a comprehensive strategy?

First.  Maps.  Maps can show where poverty is most concentrated in a geographic region like Chicago. They can show other indicators, such as poorly performing schools, violence, health disparities, etc.

This concept map points to many data platforms leaders can use to build their own map stories and map-based strategies.  I've posted more than 280 articles on this blog demonstrating ways maps can be used.  I've posted many more on the MappingforJustice blog. 

Second. Understand the different needs of kids living in areas of high poverty vs living in other areas. Then inventory existing youth serving programs to understand what programs are serving which kids.

View the graphic shown above in this article.  It's one of several articles in this group, that focus on designing youth programs based on the needs of the youth being served.  View this article to learn of the Tutor/Mentor Connection's 1992-2010 efforts to collect, map and share this information.

Then, look at articles like these, asking "How Many Youth Programs are Needed?"

Concept maps can also serve as blueprints, showing what's needed at each age level. Use this map as a starting point, then create your own version.

Understand what other programs and leaders are already doing, in Chicago, and around the world.
Open the Tutor/Mentor Library and look through the different categories and sub-categories.  There are more than 2000 links to other people's ideas that you can borrow for your own planning.  Don't reinvent the wheel if you can avoid it.  Don't start something new if there's already a project in place that you can support.  


Third. Use this information in an on-going planning process.

This concept map shows the planning cycle. 


This concept map shows planning needed, that fills areas of the map with a full range of programs helping kids through school and into adult lives, and keeps those programs fully funded for 10-20 years.


Before you do any of this, view this "Role of Leaders" visual essay, which I created in the late 1990s.  Look at "Step 2" on Page 10, where it says "Appoint a "get it done" leader.  and "Step 3" on page 11, where it says, "Do your homework."   Then, look at "Step 7" that focuses on CEO commitment to  year-to-year growth and process improvement.  


I share 30 years of thinking on this blog and on the www.tutormentorexchange.net website that leaders can use to build a comprehensive, long-term plan that actually reduces violence because it reduces the root causes, reaches kids and families in every high poverty area, and reaches the larger community to build and sustain the commitment, and financing, needed.

I've been spreading this message for over 30 years.  But, too few have ever heard what I've been sharing because I had too few resources to tell the story with reach and frequency.

That's still the case. But now, anyone who reads any of my articles can share them with their network, create their own versions, and build the awareness and commitment needed for building and sustaining strategic, long-term plans.

I'm on Twitter (X), Facebook, LinkedIn, Instagram, Mastodon, Bluesky and other places. You can find links on this page.  Please connect with me. Share your own vision and strategies.

I'm also dependent on a small group of  donors to help keep this information available.  Visit this page and send a contribution if you'd like to help me. 

Tuesday, November 24, 2015

Planning needed to fight war on poverty in big cities

I created this presentation a couple of  years ago to show planning needed to build and sustain needed services in all high poverty areas of a big city.  Take a look.


Below is a concept map that shows this in a different way: See link.

The graphic below, showing a news article from 1993, illustrates that this has been a long-term problem with many, many distractions preventing the type of strategic planning and acting that I describe in my blog articles.


I included this graphic in this story.  After the riots; after Thanksgiving; after Christmas and year-end holidays:  Do The Planning.

Tuesday, January 21, 2020

A New Call To Action from Chicago Tribune

Chicago Forward - Chicago Tribune
A couple of weeks ago the Chicago Tribune launched a  new call to action to reach Chicagoland's disconnected youth, inviting reader ideas.

I've been responding to these "calls to action" for more than 25 years with ideas and strategies posted in my newsletters, web sites and on this blog.  Instead of re-writing all this again, like some sort of narrow grant proposal, I invite city planners to skim through the information that has been available to them for so long, then invite me into their brainstorming and planning where I can help them understand it and ways to apply it.

I shared this with Bruce Dold and the Chicago Tribune on a few Tweets which I'm showing below:


Since October 2019 I've been attending meetings hosted by Mayor Lori Lightfoot's team, which is developing a plan that also aims to reach youth throughout Chicago. Here's one Tweet that I posted.


Here's another one where I focus on the long-term, flexible funding needed to support youth serving programs in every high poverty neighborhood. This needs to be part of the planning.


Here's a Tweet that focuses on the talent needed in every single youth program.


Here's another Tweet, visualizing the many challenges facing youth and families in high poverty areas. Just focusing on providing youth programs won't address the many other issues.


I've been using Maps since 1993 to focus attention and resources to all high poverty areas of Chicago and its suburbs. Here's one Tweet showing that.


Finally, here's one where I show the Tutor/Mentor Program Locator search page, which the Tutor/Mentor Connection launched in 2004. Prior to that we had shared our list of programs via a printed directory, first published in 1994.


This is just a sample of the information available to the planners at the Chicago Tribune, Chicago SunTimes, City of Chicago and other places. There's so much here that included in any planning needs to be a focus on learning.

Below is a video showing steps to learning all this information, created by one of the interns from South Korea via IIT who worked with me from 2006 to 2015.


One of my Tweets posted above shows the front page of the October 15 Chicago SunTimes, which also was a call to action. This is a deeply rooted problem that requires involvement of many sectors, in many ways, and for many years.

The media and city leaders need to take on the intermediary role that I've consistently taken, to encourage others to look at this information, discuss it, then incorporate what they learn in actions that make birth to work youth tutor/mentor programs available in every high poverty area of the city and suburbs.

I'm on Twitter, Linkedin, and Facebook where I hope to connect with others who will help share these ideas, while adding their own.


Tuesday, July 22, 2025

What's your problem-solving process look like?

While I've tagged over 130 article on this blog with #planning, probably most of the one-thousand plus articles posted here since 2005 focus on the planning needed to help great, on-going, mentor-rich programs reach K-12 youth in all areas of persistent poverty. 

I show planning steps and information mapping below.  Do you have visualizations like these to show your problem-solving process? 

This concept map highlights steps in an on-going planning process which aims to influence what resource providers, businesses and policy-makers do, not just what kids, educators, program leaders and parents do.  click here to open

Below is another version of this planning process. click here to open


On both concept maps you'll see geographic maps used at the beginning of the planning process.  Unless you define what places you want to help, using a map, you could get a lot of people together, spend a lot of money, and still miss a lot of the places that need help the most.

On both concept maps I show a next step, of gathering available information about the problem, who's already working to solve it, who should be involved in planning and action steps, etc. 

Using that information the Tutor/Mentor Connection (1993-present) began creating maps to show locations of non school, volunteer-based tutoring and/or mentoring programs in 1993 and to follow media stories about shootings, gangs, or poorly performing schools, with map stories that talked about the availability (or lack) of tutor/mentor programs in the area surrounding the incident.  

My goal has been that maps and the library of programs and research be used by leaders in business, government, colleges, hospitals, faith groups and government to fill high poverty neighborhoods with a wide range of  youth development and workforce development based tutor and mentor programs.
(Read more in this article)

The map below is another example of my use of maps. 

I used these maps in this article. It shows how maps can be used in planning, to identify stakeholders who should be involved in the process.  It should lead to questions such as, "Do we invest in helping existing programs grow?  or, "Do we invest in new start-ups?"  The planning process should provide answers.

Here's another article, titled "Use Maps for Understanding and Serving Areas of Need."

In the concept maps at the top of the page I include links to the research section of the Tutor/Mentor library. It's shown in the map below. click here to open


The small boxes at the bottom of each node contain links to external websites and pages of my library, and to additional concept maps.

My goal has been to expand the information planners had available when developing new solutions to persistent problems.  A research team could dig into my library and the websites I point to when starting a planning process.  Ideally they already would have spent many hours learning what's in the library, so when a grant opportunity or new policy initiative is being discussed, they already know where they can find large amounts of information.

Concept maps can help people navigate this vast library.  Here's one of many articles I've written showing uses of concept map. 

I added two new resources to the research section of the library today.  Below is a view of one page from an extensive "Poverty & Wealth  Inequality" project created by Gene Bellinger, a systems thinking pro who I've learned from for more than a dozen years.  You can see his influence in the planning map shown at the top of this article.  


Open this link to start your journey.  Gene has used AI to create a series of stories and relationship maps, that show a not-to-distant future where the rich and powerful have taken full control. His stories show how people have built a resistance that ultimately overthrows that government and replaces it with one more fully committed to the welfare of all people and the planet. Open the link to start reading the stories and open more and more pages.   

You won't see the interactive graphic shown above until you open the html file that Gene points to in the upper right of the page.   If you open that file you'll find an interactive map. That means you can zoom in to look more closely at different elements. You can click on nodes to read the text. You can create and share your own versions, as I'm doing. 

There's a load of information.  When you open the link to start your journey you'll see a list on the left side of your screen, which I show below.  


Each link on this page opens to a story, with additional maps.  As my #CLMOOC friend Terry Elliot would say, it's like "going down a rabbit hole" of learning. You just keep going deeper and deeper.

View this short video to see Gene Bellinger's introduction to AI Modeling.

Which leads me to the map shown below.  At the top of the third column from the left is a "Project 2025" link.  Click here to open that page. 


If you don't go any further you'll be lost because the concept map shown with the article has so many nodes that it's impossible to read.  However, if you open the html version, as I did, you can zoom in to look more closely at the elements on the map.  For those concerned with the direction the USA is going, this is a valuable map. 

Last week I wrote an article titled "Solving problems? Know the Network."  I pointed to a Power Mapping article that provides steps for learning who you should be connecting with to be able to solve the problem you're trying to solve (or to build the business you're building).  The Project 2025 map is an example of Power Mapping. 

All of this is just part of the first stage of a planning process.  It's really on-going because problem solving is cyclical. As you solve the first problem you face new problems, which require new information, and new people and resources.   Furthermore, this process is at different stages in thousands of places where people are trying to solve the same problem.  If information showing what each group is doing is available in web libraries, planners should be able to learn from each other, and not be constantly "reinventing-the-wheel". 

One of your challenges will be to build this network, then sustain and expand it over many years.  That's Step 1 in the concept map shown below. 


However, it's Step 2 and Step 3 that are more difficult.  Step 2 focuses on generating on-going attention that draws a growing number of people to the library and blogs like mine.  Step 3 focuses on helping people find what they are looking for, understand what they find, and apply what they learn in actions that help solve the problem you're focused on.

If the process works, it leads to Step 4, where planners find lists of organizations to support, or tools to fill voids where new organizations are needed.  The public awareness generated in Step 2 aims to motivate people to volunteer time, talent and dollars supporting youth serving programs in the area planners are focused.  In my case, that's been the Chicago region since 1993.  My list of tutor/mentor programs can be found here. 

I've never had much money for any of this, particularly Steps 2 and 3.  So I've focused on motivating other people to share the message and help build understanding.  It's what faith leaders have done for over 2000 years.  

How might athletes and celebrities support this process?  In February 2024 I wrote this article after watching the NFL annual awards presentation.  I wrote this article in 2023.  These show how athletes in major sports and many celebrities could go beyond the individual charity efforts they support to call greater on-going attention to the needs of entire neighborhoods and cities.  I wondered if anyone was aggregating information about all the foundations and causes athletes and celebrities support, so a  library and Power Map could be created that planners could use to better understand who is, or is not, being served, and who might be able to help draw greater attention to specific issues.   

Is anyone doing this?

7-23-2025 update - read this post by Dave Snowden and you'll see the same thinking as in my planning maps.

Thanks for reading.  Share your thoughts about mapping information libraries with me on LinkedIn, BlueSky and other social media platforms (see links here). 

If you value what I'm sharing please make a contribution to help me pay the bills.  Click here

Saturday, July 08, 2017

Cost Analysis - to employ 32k high risk male Chicago youth and adults

From WBEZ91.5Chicago
How much would it cost to create a jobs program that employs 32,656 men who live in the highest violence plagued Chicago neighborhoods. These are men who are are at the highest risk of being a victim and/or offender.  That is the question WBEZ reporter Chip Mitchell attempts to answer with this analysis.

His answer: $1.1 billion, for the program's first year.  However, as he writes:
But, just for context, it’s around the planned cost of redeveloping Union Station downtown. It’s also roughly what Illinois spends to keep its violent offenders in prison for one year.  
I was interviewed for this project, about the cost of mentoring this population, and encouraged Chip to step back and think of the systems needed to reach and employ this group. I also told him how much I appreciated being asked for my thoughts, since so few leaders in Chicago have ever reached out to me in the past 30 years as they were planning new youth development initiatives.

I think Chip has done a comprehensive analysis, with the aid of Joseph Persky, a University of Illinois at Chicago economist.  However, I think there are many other things that need to be considered in determining a price tag and launching this effort.

Take a look at the graphic below:

I think it will be easy for WBEZ to create maps that show the neighborhoods they are targeting. They already do a great job of creating similar maps and posting them on their web site.  

In the above graphic, the map at the left shows neighborhoods targeted by an anti violence initiative launched by the Mayor's office in 2013. The map at the right shows all poverty areas in Chicago. I used these maps in a 2013 article to emphasize the need for funding youth tutor/mentor programs in other neighborhoods, not just the target areas.

Above the maps is a birth-to-work graphic, emphasizing the need for funding and volunteer support of youth programs that reach kids early and stay connected, with age appropriate support all the way until they are in jobs and careers.  The yellow highlight shows the age group of men that the WBEZ write up targets.  The pink bar shows what's not included. Furthermore, since this project only focuses on men in the age 16-34 age group, there will be additional costs to employ women in these areas.

This project is important, and needs to be tried. However, unless funding supports boys and girls in all poverty areas, and all age groups, I think we'll be paying this $1 billion or more every year into infinity because we've not fixed the pipeline.  I also believe we'll also still be paying many of the costs of poverty and incarceration that the project seeks to reduce.  The additional costs of making mentor-rich programs available to youth and every poverty area has not been calculated.

Even if we only focus on the WBEZ target group and neighborhoods, there's still more to think about. Take a look at this graphic.

Planning Cycle - War on Poverty
I've used this graphic in many articles, such as this one.  Whoever takes the lead on this project needs to put together a planning map, that takes into consideration everything from Step 1 to Step 7 on this graphic. And Step 7 will be the most difficult. That's the one that focuses on building and sustaining the public will to fund this project, not for one year, but for many years.

Does the funding analysis cover the costs of this planning process?

Here's another consideration. This 4-part strategy map can be viewed at this link, and is described in this presentation.

The WBEZ article, and all the research that went into creating the analysis, would be included in Step 1, which is the information we use to understand a situation and look at possible solutions.

What I think is missing from the WBEZ analysis of cost is Step 2 and Step 3.  What type of on-going advertising and public education will be needed, over many years, to draw enough leaders from business, philanthropy, government and non profits together to build the public will to fund this project and keep it funded?  What type of on-going outreach will be needed to reach and involve those 32,000 men who are the focus of this project?

WBEZ posting this article on their web site, then sharing it on social media where I and others could find it and give it more readership through our own Tweets, likes and re-tweets is one part the strategies I focus on in Step 2 and 3.  Me writing this article and sharing it often on social media and in my email newsletter, is another. These actions will need to happen over and over, for many years, with many others writing their own blog articles, to make sense of the project and to attract more and more who take a similar role.

I don't know the answer to the questions I'm posting, but do know that this planning could benefit from some additional systems thinking and process mapping, so the full project is better understood by more people, and the full cost can be better determined.  To focus attention on the strategy map I created a new video to highlight the four sections of the map. I hope you'll take time to view it.


I've been using visualizations and concept maps for nearly 20  years to help people understand the ideas I have been sharing, show the information I've been aggregating, and demonstrate a process that I feel needs to be adopted by many leaders, if we're to build the public will needed to solve the violence and reduce the poverty and inequality that's embedded in Chicago.

I know this is another long article, but here's one more set of ideas that I hope you'll read. These articles focus on systems thinking, and mapping.  They demonstrate a process and show some tools that I hope WBEZ and others will apply to help build involvement and support for comprehensive, long-term solutions.

I hope I can be included in the planning, brainstorming and thinking that is needed.  Unfortunately, that's not often been the case in past years. However, we're focusing on the future, so I'd be happy to spend time with city leaders, and planners, to talk through the ideas I share in this and other articles on this blog and the Tutor/Mentor Institute, LLC web site.

Connect with me on Twitter, Facebook or Linkedin.