I have used graphics for 20+ years to communicate ideas. Almost all related to what we need to do to build mentor-rich non-school, and school-based, support systems to help kids in high poverty areas move through school and into adult lives.
Because this blog has a vertical structure (you only see the most recent on the home page), some graphics don't get as much attention as they should. Here's an example.

We did the planning for the Tutor/Mentor Connection in 1993 and launched it with a first Chicago tutor/mentor programs survey in January 1994. Over the next few years we developed a year-round series of events intended to draw attention, volunteers and donors directly to the youth programs we were learning about in our surveys, while drawing those programs together to learn from each other.
View this video to see animation showing year-round strategy, created by intern in late 2000s.
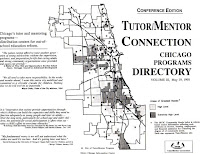
We published our list of programs in a printed directory each year from 1995 to 2003 and have shared the list on-line since 1998. You can find it now at this link.

We published our list of programs in a printed directory each year from 1995 to 2003 and have shared the list on-line since 1998. You can find it now at this link.
We started using maps of Chicago in 1993 to show where non-school tutor/mentor programs were most needed, based on poverty, poorly performing (and poorly funded) schools, etc. We plotted locations of existing programs on these maps. I've posted more than 250 articles demonstrating how maps can be used and created an entire blog focused on uses of maps.
 You can find me on each of these social media platforms
Conferences in May and November, a city-wide volunteer recruitment campaign in August/September, a Tutor/Mentor Week in November were events my team organized. We drew upon the January National Mentoring Month publicity to try to build renewed attention to tutor/mentor programs in February, when many were looking to replace volunteers who had dropped out over the holidays. We had other goals but they never were able to be developed.
Visit this page to read more about these activities.
Visit this page to read more about these activities.
We're now in the Back-to-School volunteer-recruitment period and this morning I looked at this blog to see when I last used this graphic. It was last November, in this article.
It's an important concept because it emphasizes the role anyone can take to draw attention to youth serving programs in their community. I'll share this on Twitter because while there are countless politicians calling for your votes, and your dollars, I don't see many (if any) using their Tweets to draw volunteers to youth serving programs in the districts they want to represent.
Maybe this can encourage a few to add this message to their posts.
While I no longer organize conferences or a site-based volunteer-recruitment campaign, I still host a library and encourage youth programs, volunteers, youth, business, donors and others to draw ideas from it that they use to help kids in poverty move safely from birth to work. Furthermore, I share history of events I organized, such as the recruitment campaign, and the tutor/mentor conferences, with the goal that others in Chicago and other cities will create their own versions of these, and their own year-round calendar of youth support events.

And, you can help me cover the costs of keeping this information available to you and others around the world by visiting this page and making a small contribution.
Thank you for reading and sharing my articles.
If you scroll back to articles from past years are there some graphics that I used in the past that you think I should emphasize with a new post? Let me know.
If you scroll back to articles from past years are there some graphics that I used in the past that you think I should emphasize with a new post? Let me know.


No comments:
Post a Comment